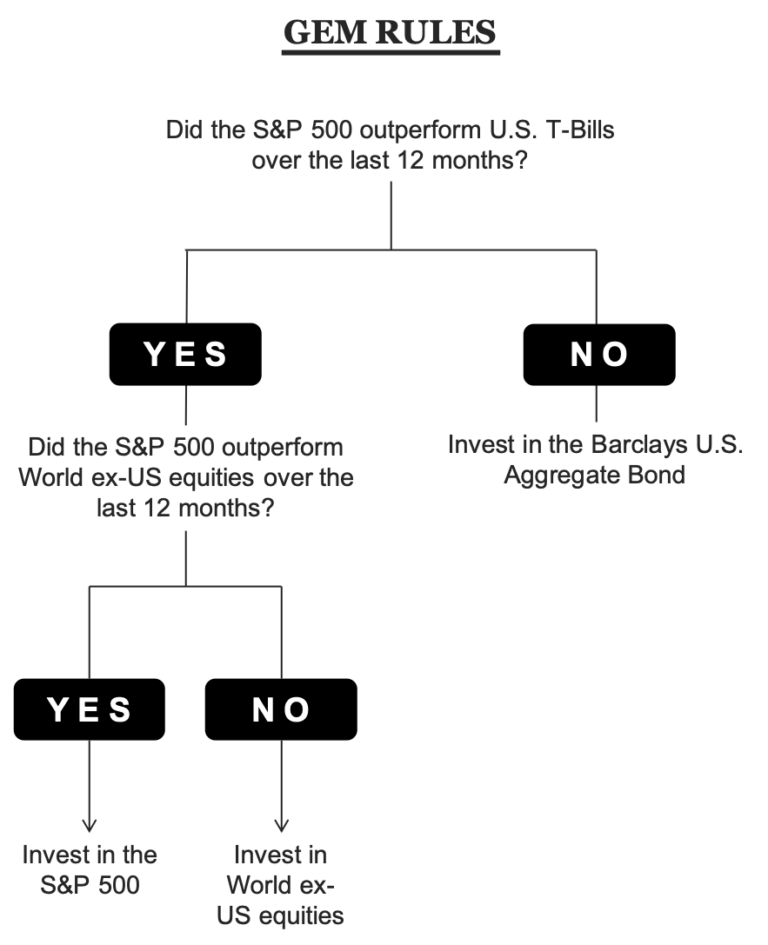
Gary Antonacci created the Global Equities Momentum (GEM) model that applied dual momentum to stock and bond indices. It toggles between stocks and bonds using 12-month trailing returns. And when it toggles to “stocks,” it chooses between US equities and International (ex-US) equities based on whichever posted higher returns in the previous 12-months. Newfound Research has a chart that puts it across succinctly:

The model uses the S&P 500 index as a stand-in for US equities and the WORLD ex USA index for international stocks. However, there is nothing in the construction that prevents us from replacing those market-cap based indices with momentum based ones.
US Momentum / Market-cap International
Scenario 1: keep everything the same, except in the last stage, instead of buying S&P 500, buy US Momentum (SP 500×1).
Scenario 2: swap out S&P 500 and put US Momentum everywhere in the decision tree (MOM).
In the cumulative return chart below, the black line is the base case. It represents GEM as originally designed. The red line is Scenario 1 above, green is Scenario 2.

Even though Scenario 2 has higher returns, it comes at the cost of higher drawdowns. Scenario 1 seems to strike a compromise.
Base case drawdowns:

Scenario 1 drawdowns:

Scenario 2 drawdowns:

US Momentum / International Momentum
What if, we bought International Momentum (WORLD ex USA MOMENTUM) instead of the market-cap based WORLD ex USA?
Scenario 3 (dark blue): keep everything the same, except in the last stage, instead of buying S&P 500, buy US Momentum. And instead of buying market-cap international, buy WORLD ex USA MOMENTUM (SP 500×2).
Scenario 4 (light blue): swap out S&P 500 and put US Momentum everywhere. And instead of buying market-cap international, buy WORLD ex USA MOMENTUM (MOMx2).
Scenario 3 drawdowns:

Scenario 4 drawdowns:

Here are returns broken down annually for all the scenarios discussed above:

It appears that using the S&P 500 index for making decisions about buying US vs. World ex-US momentum boosts returns while keeping a floor under drawdowns.
Code and charts are on github.
