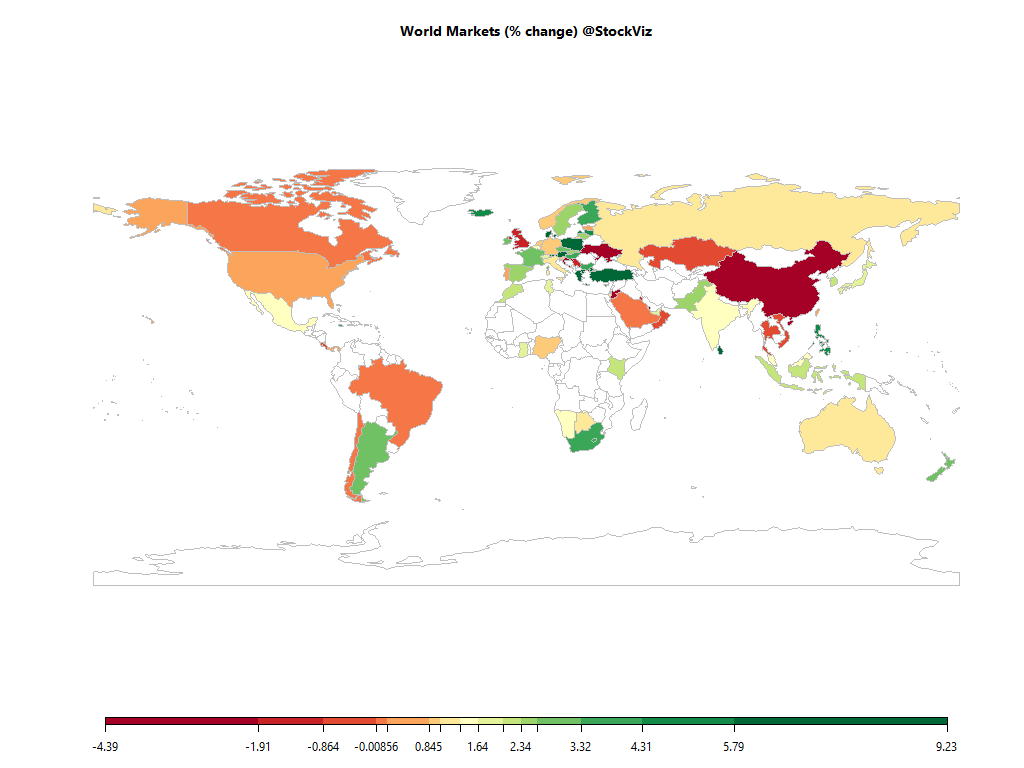
Equities
| MINTs | |
|---|---|
| JCI(IDN) | +2.10% |
| INMEX(MEX) | +1.49% |
| NGSEINDX(NGA) | +0.98% |
| XU030(TUR) | +7.02% |
| BRICS | |
|---|---|
| IBOV(BRA) | -0.01% |
| SHCOMP(CHN) | -2.11% |
| NIFTY(IND) | +1.42% |
| INDEXCF(RUS) | +1.04% |
| TOP40(ZAF) | +4.22% |
Commodities
| Energy | |
|---|---|
| Brent Crude Oil | -1.74% |
| Ethanol | -2.63% |
| WTI Crude Oil | -2.99% |
| RBOB Gasoline | -9.46% |
| Heating Oil | -4.41% |
| Natural Gas | +2.79% |
| Metals | |
|---|---|
| Platinum | -0.92% |
| Copper | -2.26% |
| Silver 5000oz | -5.52% |
| Palladium | +3.04% |
| Gold 100oz | +1.11% |
Currencies
| MINTs | |
|---|---|
| USDIDR(IDN) | +0.05% |
| USDMXN(MEX) | +0.55% |
| USDNGN(NGA) | -1.51% |
| USDTRY(TUR) | -2.06% |
| BRICS | |
|---|---|
| USDBRL(BRA) | +1.36% |
| USDCNY(CHN) | +0.09% |
| USDINR(IND) | -0.93% |
| USDRUB(RUS) | +1.21% |
| USDZAR(ZAF) | -0.66% |
| Agricultural | |
|---|---|
| Coffee (Robusta) | -10.25% |
| Feeder Cattle | +11.81% |
| Lumber | -0.68% |
| Sugar #11 | -4.27% |
| Coffee (Arabica) | -5.52% |
| Soybean Meal | +1.17% |
| White Sugar | -4.05% |
| Cattle | +3.42% |
| Cotton | +3.72% |
| Lean Hogs | +2.18% |
| Wheat | +0.18% |
| Cocoa | -16.04% |
| Corn | -0.75% |
| Orange Juice | +2.10% |
| Soybeans | +0.58% |
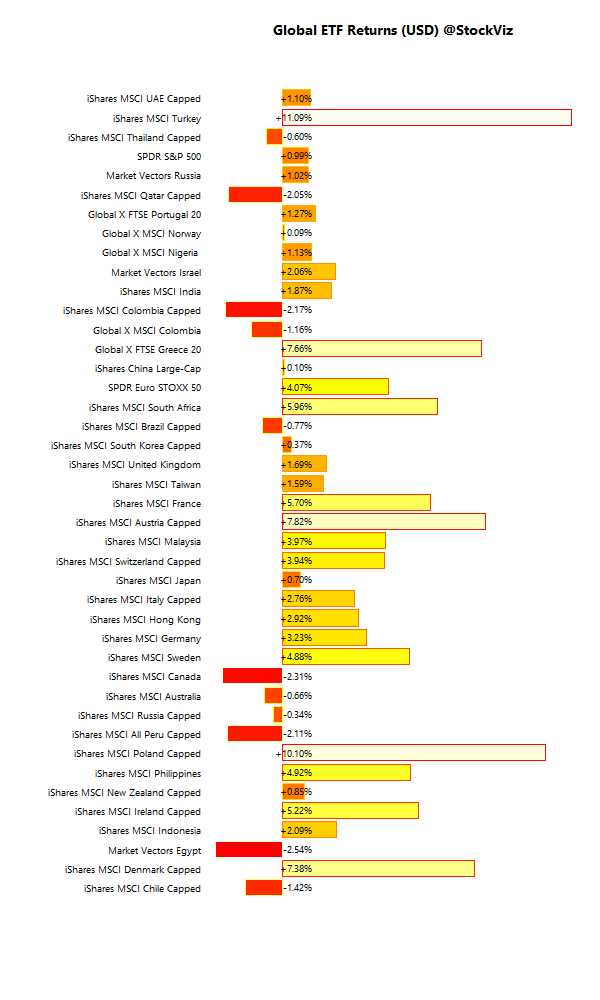
International ETFs (USD)
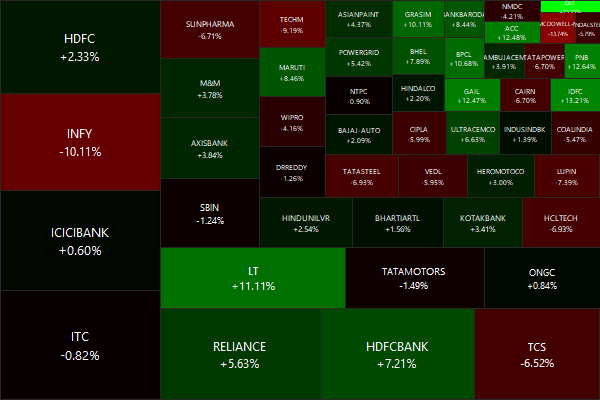
Nifty Heatmap
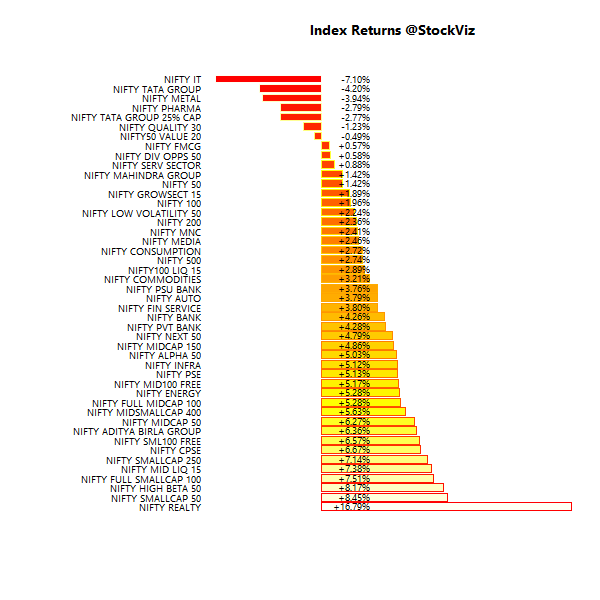
Index Returns
More: Sector Dashboard
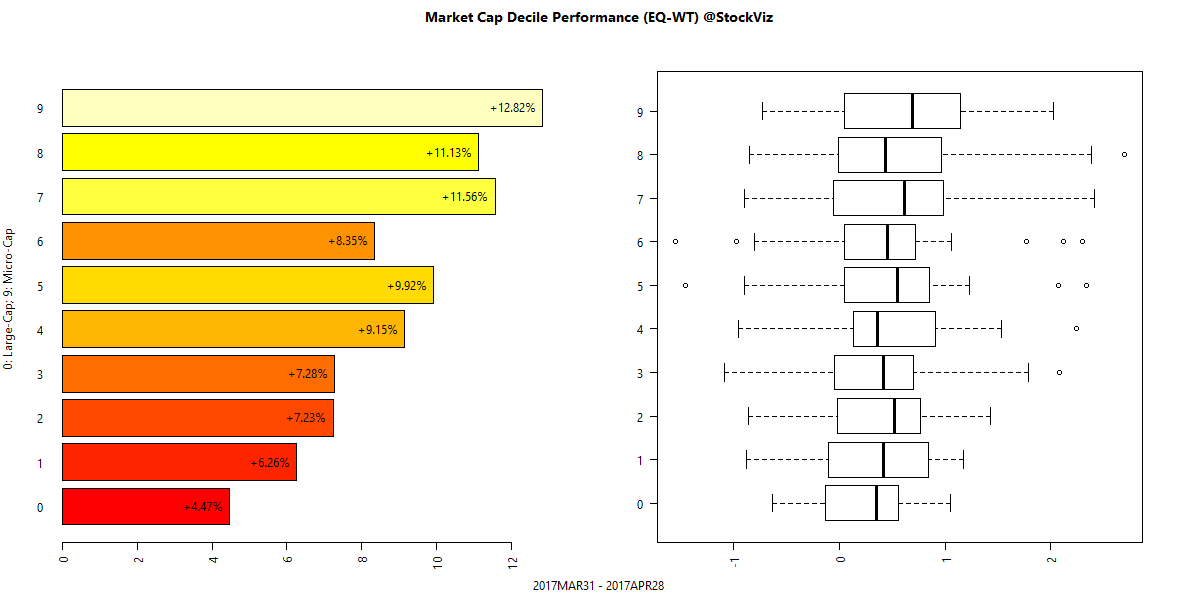
Market Cap Decile Performance
More: Equal-Weight Deciles, Cap-Weight Deciles
ETF Performance
| CPSEETF | +6.70% |
| INFRABEES | +6.18% |
| JUNIORBEES | +5.37% |
| BANKBEES | +4.10% |
| PSUBNKBEES | +3.35% |
| NIFTYBEES | +1.24% |
PSEs… because this time its different.
Yield Curve

Bond Indices
| Sub Index | Change in YTM | Total Return(%) |
|---|---|---|
| 0 5 | +0.23 | -0.11% |
| 5 10 | +0.16 | -0.31% |
| 10 15 | +0.11 | -0.40% |
| 15 20 | +0.06 | +0.07% |
| 20 30 | +0.10 | -0.45% |
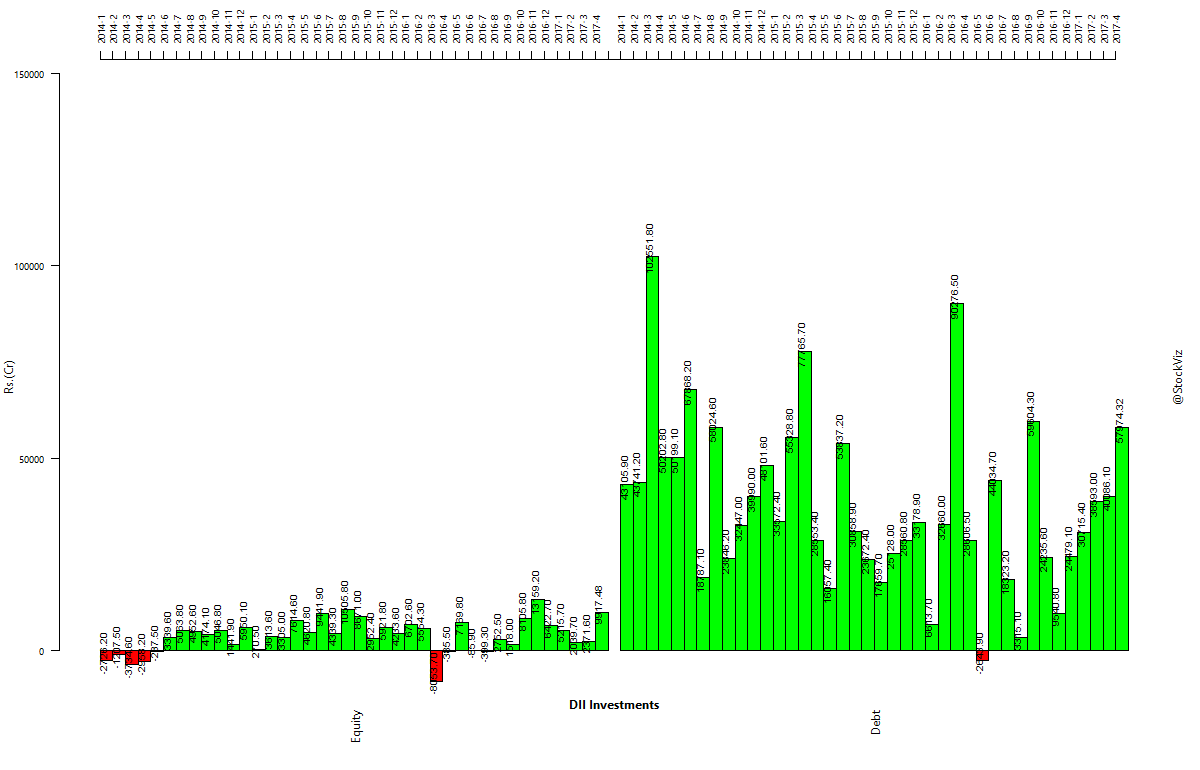
Bonds down in spite of increased FII flows…
Investment Theme Performance
| Quality to Price | +10.46% |
| Value in Flight | +8.81% |
| Financial Strength Value | +8.80% |
| Momo (Relative) v1.1 | +7.68% |
| Momo (Velocity) v1.0 | +7.27% |
| HighIR Momentum | +7.21% |
| Enterprise Yield | +7.18% |
| Magic Formula | +6.93% |
| Balance Sheet Strength | +6.27% |
| Momo (Acceleration) v1.0 | +6.19% |
| Velocity | +5.89% |
| Momentum | +3.75% |
| Acceleration | -1.18% |
Value themes out-performed momentum…
Equity Mutual Funds
Bond Mutual Funds
Institutional flows