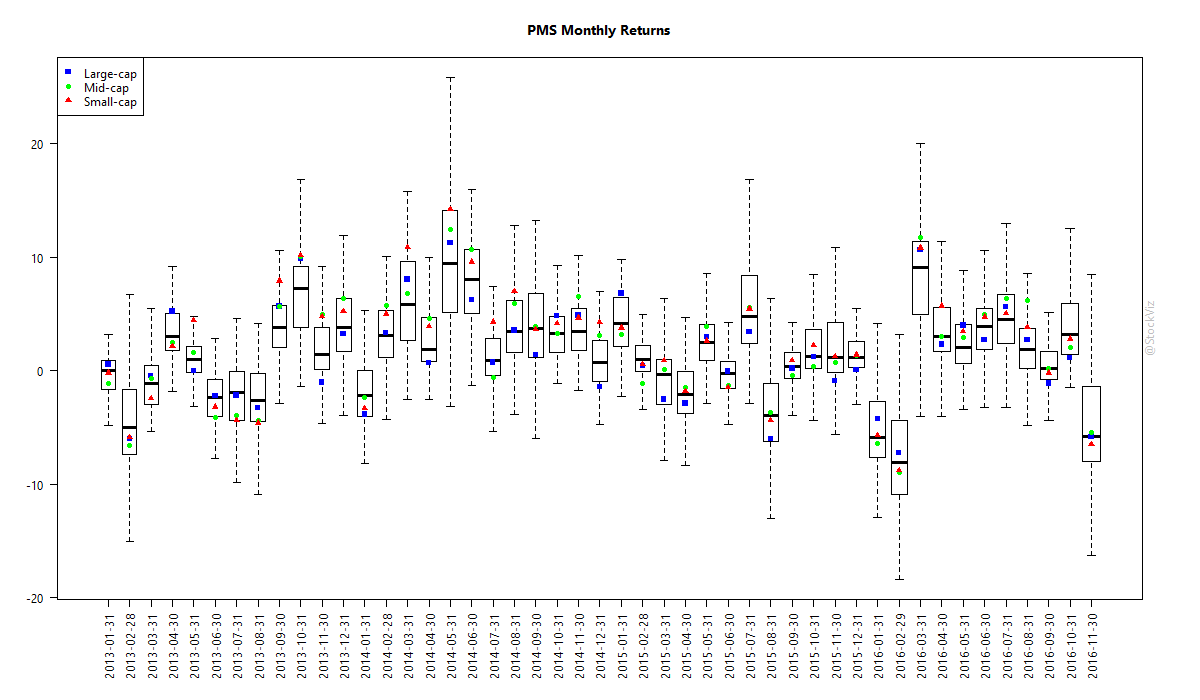
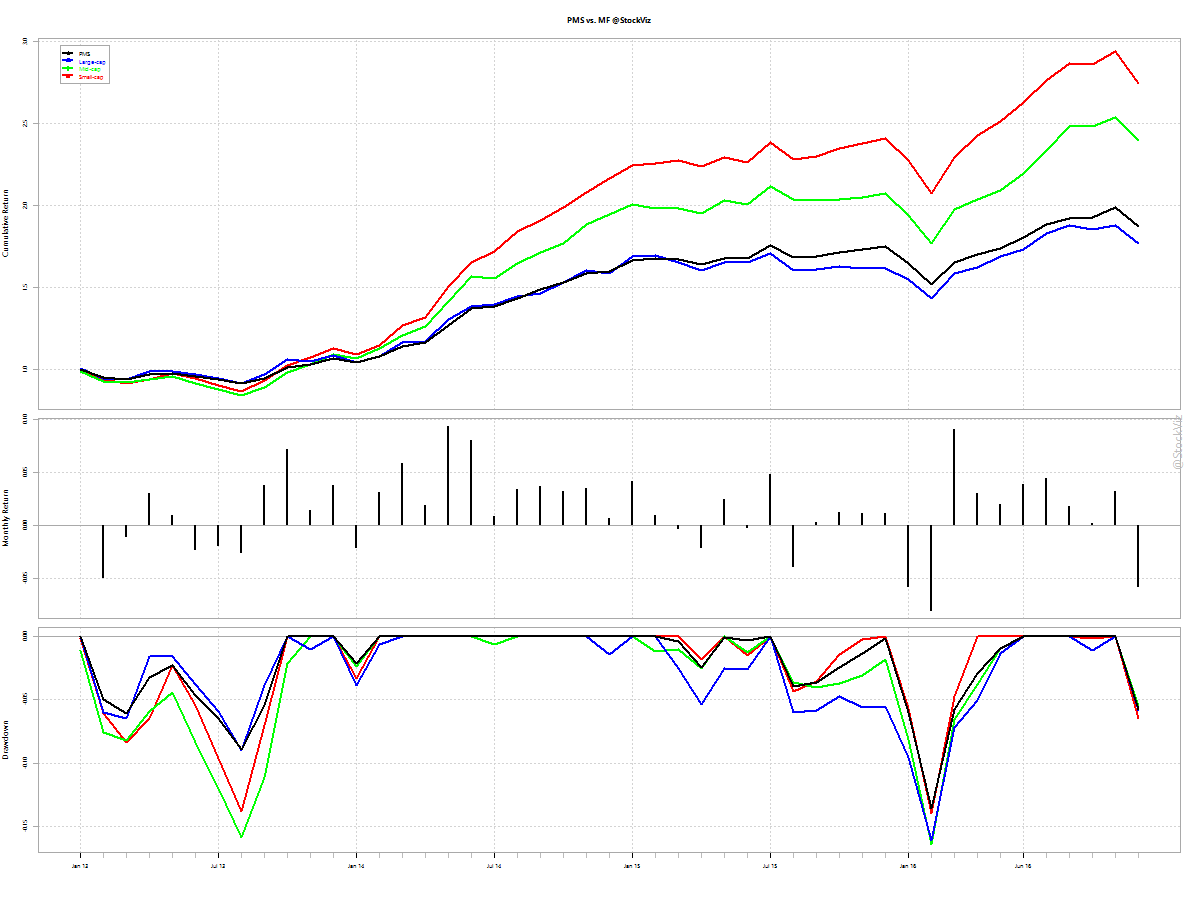
As of November this year, there are about 170 SEBI registered Portfolio Management Service providers. Until recently, their performance data was not widely available. Thanks to continued pressure from publications like MoneyLife and others, SEBI has finally published PMS details on its website. We plan to download that data and publish two key pieces of information every month:
- Performance diffusion – what is the range of performance put in by various PMSs.
- Cumulative performance – how do different PMSs compare with their cheaper mutual fund counterparts.
Monthly Performance Diffusion
On an average, there is no great benefit to investing in a PMS vs. a mutual fund. The numbers here do not include performance management fees, profit share and brokerage of PMS whereas mutual fund NAV includes everything. Plus, gains from PMSs are taxed as if it were the investor’s own trading account – with the full impact of churn – whereas mutual funds do not attract capital gains tax if held for more than a year.

Cumulative Returns
What if an investor just held onto a mutual fund instead of going through a PMS?

On an average, a PMS is unlikely to beat a large-cap mutual fund after fees and taxes.
Hopefully, SEBI keeps the performance updates going on its website. With results like this, PMSs will have a strong incentive to defy SEBI’s data collection programs. Fingers crossed!