Equities
| MINTs | |
|---|---|
| JCI(IDN) | +3.04% |
| INMEX(MEX) | +8.10% |
| NGSEINDX(NGA) | +1.83% |
| XU030(TUR) | -6.16% |
| BRICS | |
|---|---|
| IBOV(BRA) | +10.38% |
| SHCOMP(CHN) | +3.11% |
| NIFTY(IND) | +0.41% |
| INDEXCF(RUS) | +6.75% |
| TOP40(ZAF) | +4.55% |
Commodities
| Energy | |
|---|---|
| Heating Oil | +15.87% |
| Ethanol | +4.71% |
| Natural Gas | +1.65% |
| WTI Crude Oil | +4.03% |
| Brent Crude Oil | +19.84% |
| RBOB Gasoline | +38.27% |
| Metals | |
|---|---|
| Silver 5000oz | -4.07% |
| Palladium | +6.05% |
| Copper | +7.54% |
| Gold 100oz | -4.89% |
| Platinum | -3.99% |
Currencies
| MINTs | |
|---|---|
| USDIDR(IDN) | +2.06% |
| USDMXN(MEX) | -0.30% |
| USDNGN(NGA) | +7.50% |
| USDTRY(TUR) | +2.56% |
| BRICS | |
|---|---|
| USDBRL(BRA) | +5.81% |
| USDCNY(CHN) | +0.30% |
| USDINR(IND) | -0.05% |
| USDRUB(RUS) | -11.87% |
| USDZAR(ZAF) | -0.01% |
| Agricultural | |
|---|---|
| Coffee (Arabica) | -15.10% |
| Orange Juice | -13.76% |
| White Sugar | -3.00% |
| Cocoa | +6.99% |
| Lean Hogs | +0.07% |
| Wheat | +2.68% |
| Coffee (Robusta) | -2.39% |
| Corn | +3.30% |
| Feeder Cattle | -4.76% |
| Lumber | -7.83% |
| Cattle | -1.67% |
| Cotton | +7.53% |
| Soybean Meal | +6.62% |
| Soybeans | +7.05% |
| Sugar #11 | -6.49% |
Credit Indices
| Index | Change |
|---|---|
| Markit CDX EM | +0.80% |
| Markit CDX NA IG | -6.65% |
| Markit iTraxx Asia ex-Japan IG | -12.04% |
| Markit iTraxx Australia | -12.42% |
| Markit iTraxx Europe | -8.36% |
| Markit iTraxx Europe Crossover | -53.54% |
| Markit iTraxx Japan | -4.43% |
| Markit iTraxx SovX Western Europe | -1.77% |
| Markit LCDX (Loan CDS) | +0.03% |
| Markit MCDX (Municipal CDS) | -1.59% |
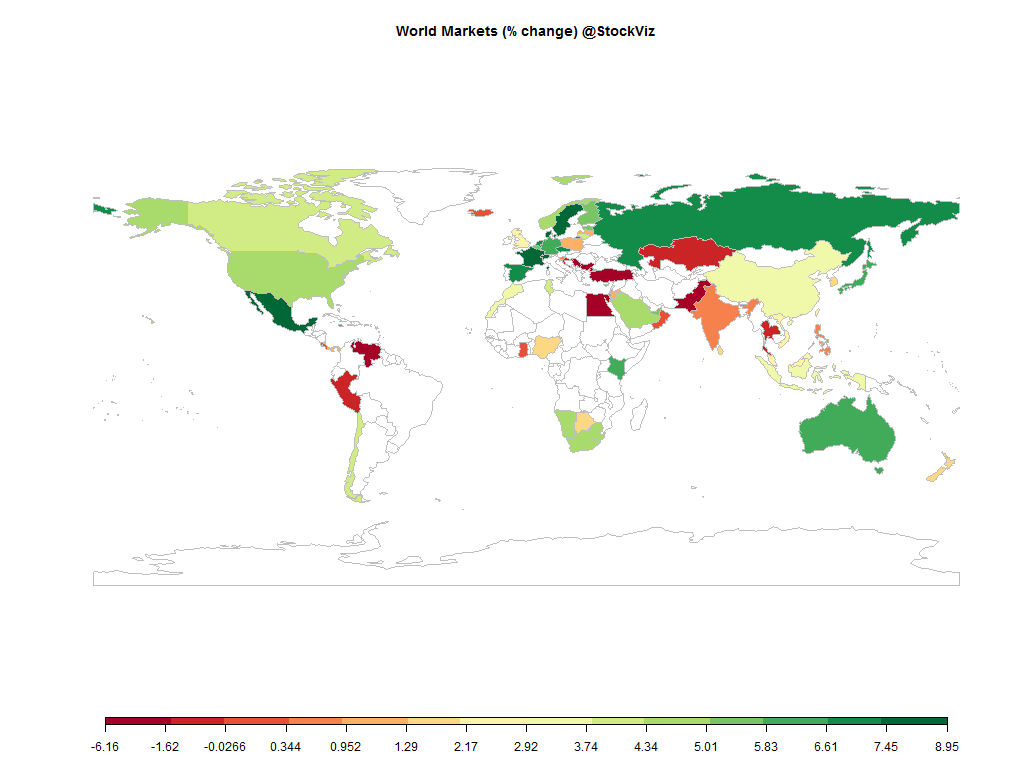
Most world markets ended in the green. The energy complex clocked in some impressive gains as well…
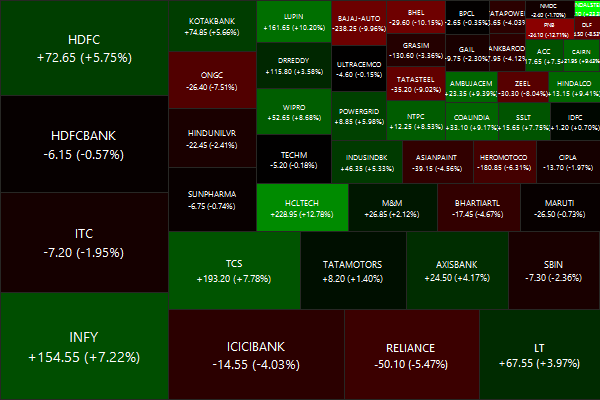
Nifty Heatmap
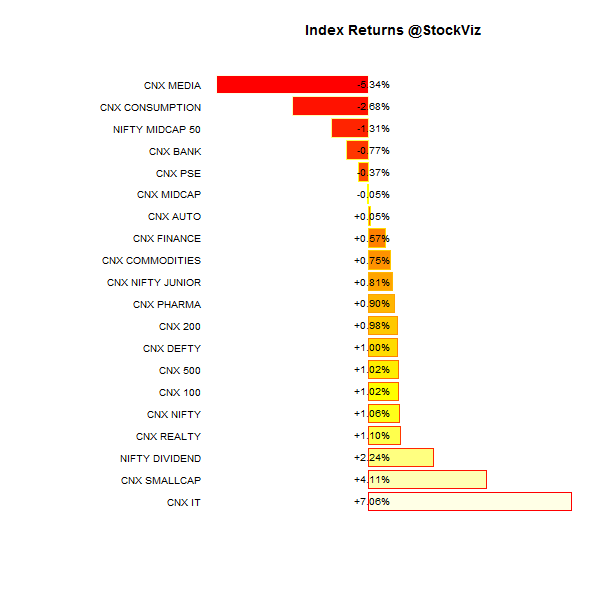
Index Returns
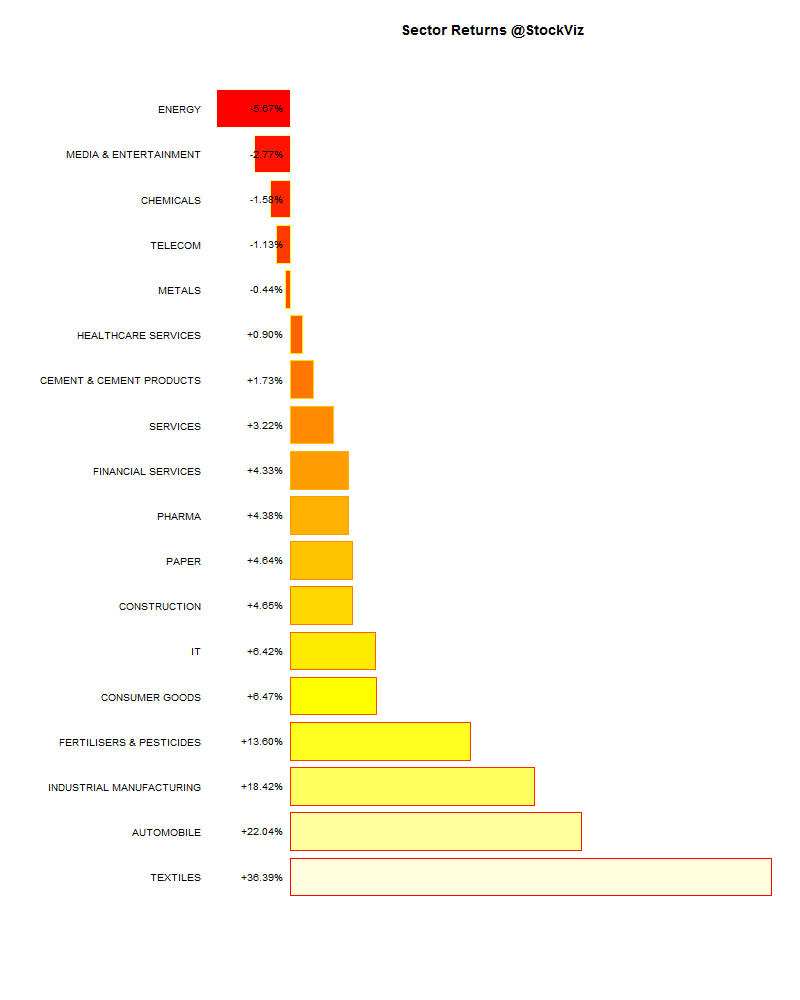
Sector Performance
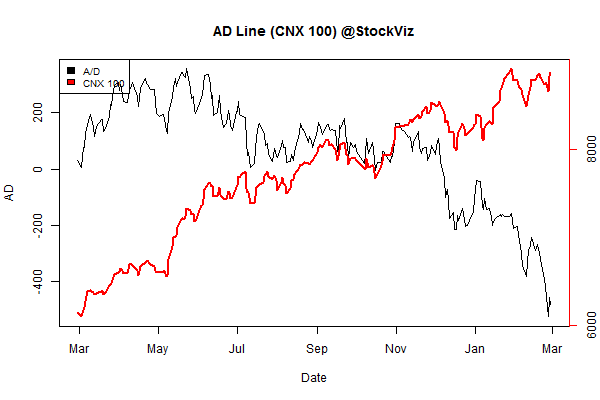
Advance Decline
Market Cap Decile Performance
| Decile | Mkt. Cap. | Adv/Decl |
|---|---|---|
| 1 (micro) | -0.87% | 66/66 |
| 2 | -3.59% | 63/68 |
| 3 | +3.03% | 62/70 |
| 4 | -1.24% | 54/77 |
| 5 | +1.86% | 67/65 |
| 6 | +1.88% | 68/64 |
| 7 | -0.26% | 59/72 |
| 8 | +3.20% | 74/58 |
| 9 | +1.42% | 67/65 |
| 10 (mega) | -0.02% | 66/66 |
Mid-caps caught a bid but large-caps were mostly in the red…
Top Winners and Losers
| BHARATFORG | +21.26% |
| JINDALSTEL | +23.38% |
| SIEMENS | +28.31% |
| UNIONBANK | -18.00% |
| RCOM | -13.94% |
| AUROPHARMA | -13.17% |
Make defense stuff in India…
ETF Performance
| JUNIORBEES | +0.31% |
| NIFTYBEES | -0.04% |
| CPSEETF | -0.36% |
| BANKBEES | -1.65% |
| INFRABEES | -1.76% |
| GOLDBEES | -5.38% |
| PSUBNKBEES | -6.40% |
Not takers for PSU banks and their bag of worries…
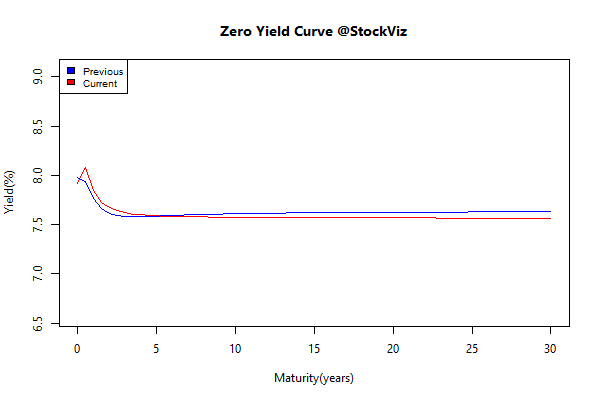
Yield Curve
Bond Indices
| Sub Index | Change in YTM | Total Return(%) |
|---|---|---|
| GSEC TB | +0.19 | +0.55% |
| GSEC SUB 1-3 | +0.34 | +0.01% |
| GSEC SUB 3-8 | +0.08 | +0.09% |
| GSEC SUB 8 | -0.04 | +0.07% |
A flat yield curve means you only get to clip the coupon…
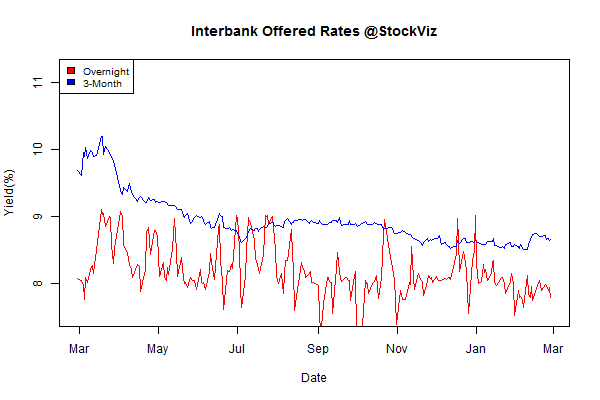
Interbank lending rates
Investment Theme Performance
| Momentum 200 | +6.53% |
| IT 3rd Benchers | +5.60% |
| Market Elephants | +5.50% |
| Financial Strength Value | +4.57% |
| The Other Value | +1.90% |
| Growth with Moat | +1.58% |
| Balance-sheet Strength | +1.33% |
| Enterprise Yield | +1.04% |
| Efficient Growth | +0.58% |
| CNX 100 50-Day Tactical | +0.13% |
| Auto | -0.90% |
| Refract: PPFAS Long Term Value Fund | -0.93% |
| Quality to Price | -1.12% |
| Market Fliers | -2.49% |
| Magic Formula Investing | -3.52% |
| Old Economy Value | -3.54% |
| Piotroski ROC Small Caps | -4.69% |
| ADAG Mania | -6.92% |
Momentum beat most of the value strategies out…
Equity Mutual Funds
Bond Mutual Funds
Thoughts to sum up the month
A business with terrific economics can be a bad investment if it is bought for too high a price. In other words, a sound investment can morph into a rash speculation if it is bought at an elevated price.