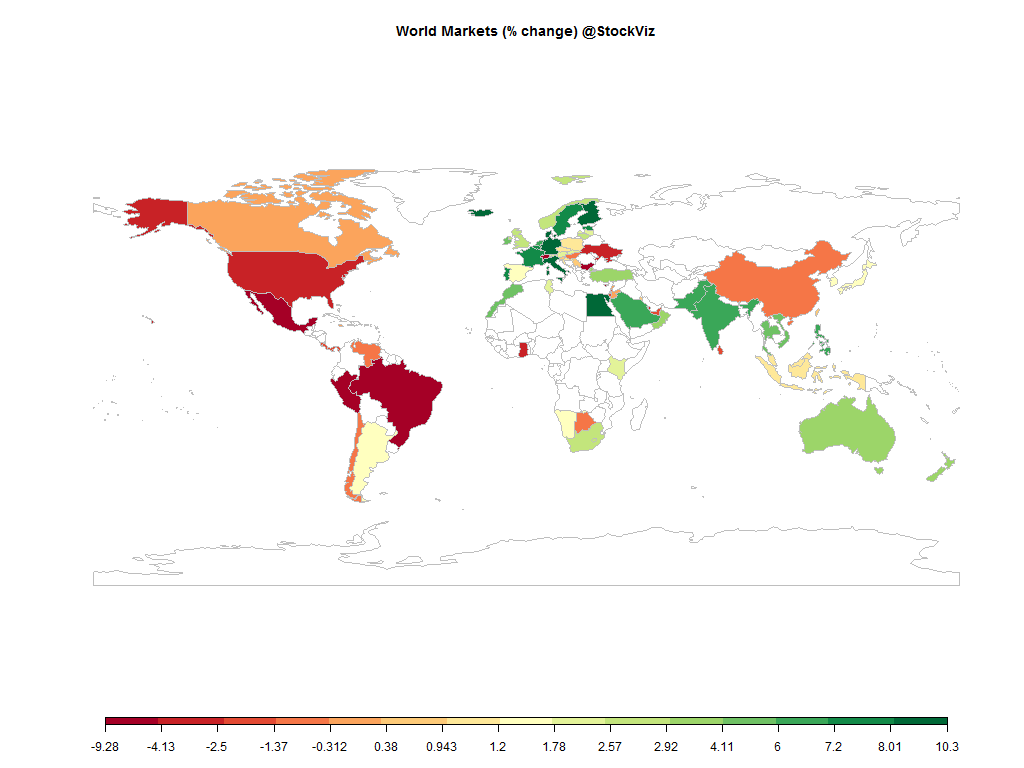
Equities
Commodities
| Energy |
| Heating Oil |
-9.59% |
| Brent Crude Oil |
-6.64% |
| Ethanol |
-15.22% |
| WTI Crude Oil |
-9.49% |
| Natural Gas |
-9.44% |
| RBOB Gasoline |
+2.30% |
| Metals |
| Copper |
-10.92% |
| Gold 100oz |
+7.99% |
| Platinum |
+2.27% |
| Palladium |
-3.38% |
| Silver 5000oz |
+9.55% |
| Agricultural |
| Cocoa |
-3.55% |
| Coffee (Robusta) |
+1.53% |
| Lumber |
-2.74% |
| Soybean Meal |
-9.07% |
| White Sugar |
-2.07% |
| Soybeans |
-5.88% |
| Coffee (Arabica) |
-4.31% |
| Corn |
-7.56% |
| Feeder Cattle |
-6.25% |
| Wheat |
-14.73% |
| Cattle |
-6.55% |
| Cotton |
-2.45% |
| Lean Hogs |
-17.35% |
| Orange Juice |
+0.07% |
| Sugar #11 |
+1.44% |
Credit Indices
| Index |
Change |
| Markit CDX EM |
-2.75% |
| Markit CDX NA HY |
-0.52% |
| Markit CDX NA IG |
+2.54% |
| Markit iTraxx Asia ex-Japan IG |
+5.51% |
| Markit iTraxx Australia |
+2.89% |
| Markit iTraxx Europe |
-7.13% |
| Markit iTraxx Europe Crossover |
-36.06% |
| Markit iTraxx Japan |
-2.64% |
| Markit iTraxx SovX Western Europe |
-2.88% |
| Markit LCDX (Loan CDS) |
+0.24% |
| Markit MCDX (Municipal CDS) |
+3.87% |
We certainly started the party with a bang: Euro QE, Swiss abandon, Rajan rate-cut… Oh my!
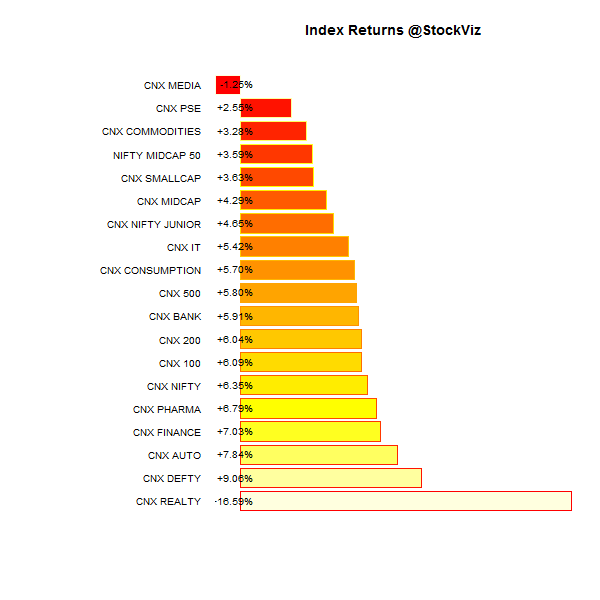
Index Returns
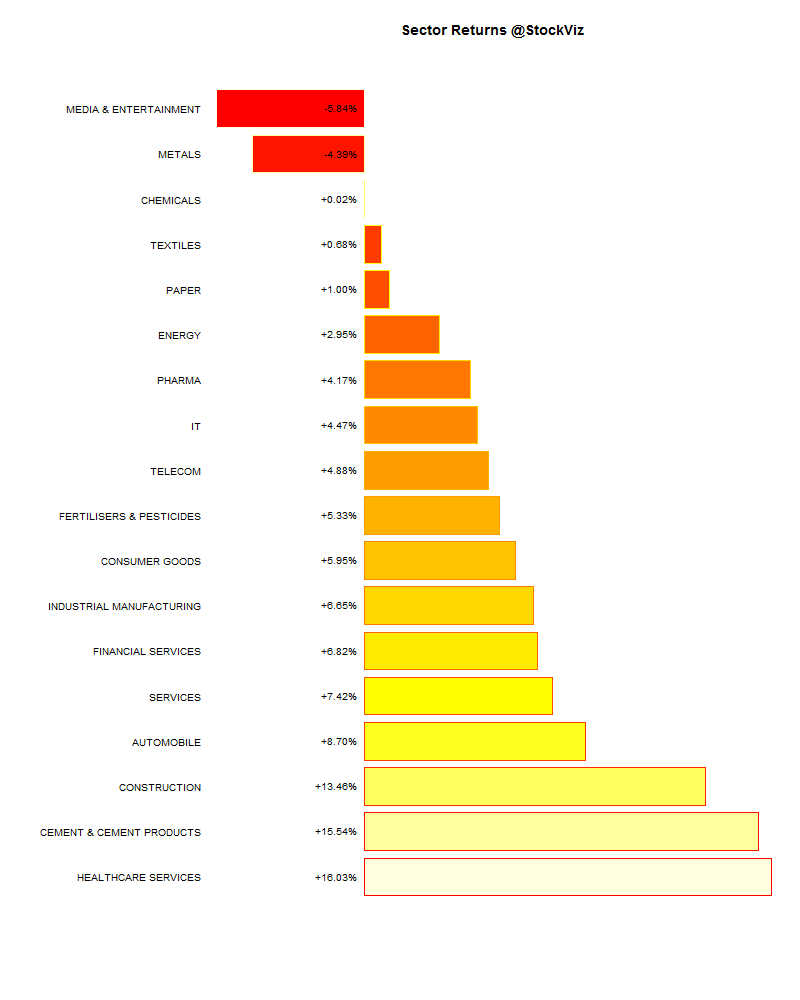
Sector Performance
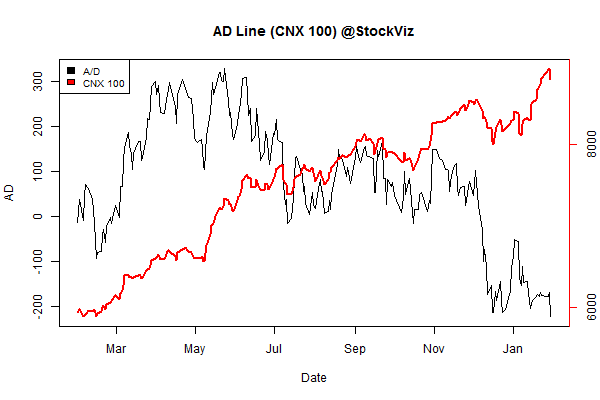
Advance Decline
Market Cap Decile Performance
| Decile |
Mkt. Cap. |
Adv/Decl |
| 1 (micro) |
-3.90% |
68/66 |
| 2 |
+2.62% |
79/54 |
| 3 |
+0.33% |
73/60 |
| 4 |
+2.82% |
81/52 |
| 5 |
+4.56% |
72/61 |
| 6 |
+3.52% |
81/52 |
| 7 |
+7.85% |
77/56 |
| 8 |
+5.76% |
76/57 |
| 9 |
+5.68% |
69/64 |
| 10 (mega) |
+8.38% |
69/65 |
Large caps did good. Midcaps not so much.
Top Winners and Losers
DLF – looks like the market likes the EMI scheme. M&MFIN and PNB got shellacked because of poor shows at earnings parade. The Adanis continued to entertain…
ETF Performance
Yield Curve
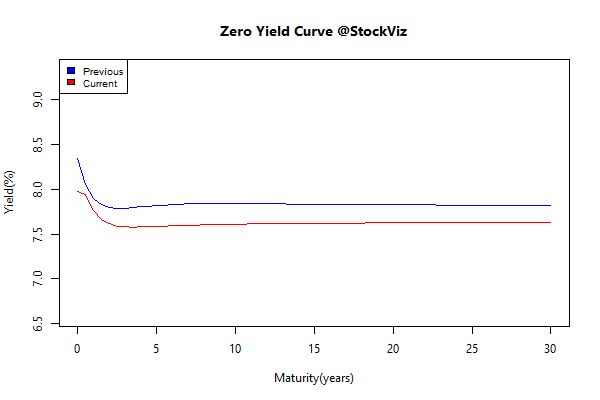
Bond Indices
| Sub Index |
Change in YTM |
Total Return(%) |
| GSEC TB |
-0.33 |
+0.74% |
| GSEC SUB 1-3 |
-0.92 |
+0.94% |
| GSEC SUB 3-8 |
-0.18 |
+1.48% |
| GSEC SUB 8 |
-0.14 |
+1.91% |
The long bond was a rock-star.
Investment Theme Performance
Equity Mutual Funds
Bond Mutual Funds
Thought to sum up the month
Is there such a thing as a “perfect” value investor? Bob Goldfarb, chief executive of the legendary Sequoia Fund, was asked by Columbia University professor Louis Lowenstein “to select ten dyed-in-the-wool value investors who all followed the essential edicts of Graham and Dodd.”
Goldfarb came up with nine. For a nine-year period from 2006 through 2014, the average return of the eight funds that survived to the end was 6.70% vs. the S&P 500 Index’s 7.99%.
Source: Looking Back at James Montier’s “Perfect” Value Investors


