
Image via Wikipedia
While discussing the buy & hold fundamental investing strategy, I had indicated that the a constant, fixed investment into a broad-based ETF would perhaps be the best way for new investors to build a diversified portfolio. The NIFTYBEES is perhaps the oldest ETF listed in the NSE: it has been tracking the Nifty 50 index since 2002.
How does a do-it-yourself SIP work? Well, its pretty simple actually. You just set aside a fixed amount every month (say, Rs. 10,000) and buy the same stock or ETF every time. To give you an example, say you started buying the NIFTYBEES on the first day of every month, since the time it was listed in 2002, it would look something like this:
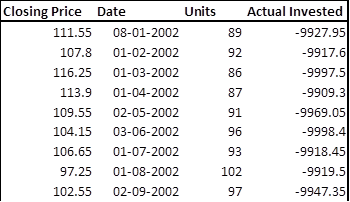
As you can see, the lower the price, the more units you will actually buy and hence the name Dollar Cost Averaging: you are averaging your buying price of the unit over a period of time.
Now say you did this irrespective of whether the market was down or up, how much would you have gained till date? My calculations show that an SIP on the NIFTYBEES would have netted an IRR of 18%. That’s not bad at all! For the those who want to have a look at the actual cashflow and returns, they can hop over to the spreadsheet on Google Docs.
Happy Investing!
