Image via Wikipedia
We had briefly discussed stock and enterprise valuation metrics before. These metrics are collectively called termed “Fundamentals”, i.e., these multiples are intrinsic to the company and not dependent on the broader market. Fundamental investors invest on a stock looking at it’s valuation relative to its peers, its future earnings potential, free cashflow, dividends, etc. There is another breed of investors that trade based on a stock’s past market data, primarily price and trading volume.
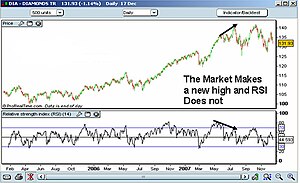
Technical analysts examine what investors think about a particular stock and whether or not they have the wherewithal to back up their opinions; these two concepts are called psych (psychology) and supply/demand. They employ models based on price and volume transformations, such as the relative strength index (RSI), moving averages (SMA), price correlations, business & stock market cycles and recognition of chart patterns. The basic underlying premise is that:
- all relevant information is baked into the price & volume action of a stock,
- prices move in trends (up, down, or sideways), and
- history repeats (investors collectively repeat the behaviour of the investors before them)
Technical trading fits nicely into programmed trading – computers are way faster at calculating and executing trades than people. By removing fundamental metrics out of the picture and focusing on pure market driven computation, machines can act in a very quantitative and non-subjective fashion.
Technical analysis alone may not be the best option for most investors. No matter how strong the technicals are, fundamentals eventually catch up. The best approach to investing is one that combines both the approaches: shortlist stocks based on fundamentals and watch their technicals at regular intervals. Execute only when the technicals flash green (or red).
