Can’t decide between quality, low-volatility, high-alpha? Why not buy all of them?
Our previous post discussed how you can use the historical performance of different factors to avoid falling into a factor-trap. However, can factor investing be further simplified?
The NSE Strategy Indices
The NSE has published a whole library of factor indices. Some of them are pure factors – like quality, low-volatility, etc – and some are hybrids – like alpha-quality-low-volatility (sort of like a shampoo-conditioner-face-wash 3-in-1.) You can explore their website if your curious.
The question is, what if you just took quality, low-volatility and high-alpha (a proxy for momentum) and just equal weighted it? Why choose when you can have all? This is the essence of the Multi-Factor approach to factor investing.
Equal-weighted Factor Portfolio
Even if you did a quarterly rebalance, you did better than NIFTY 50.
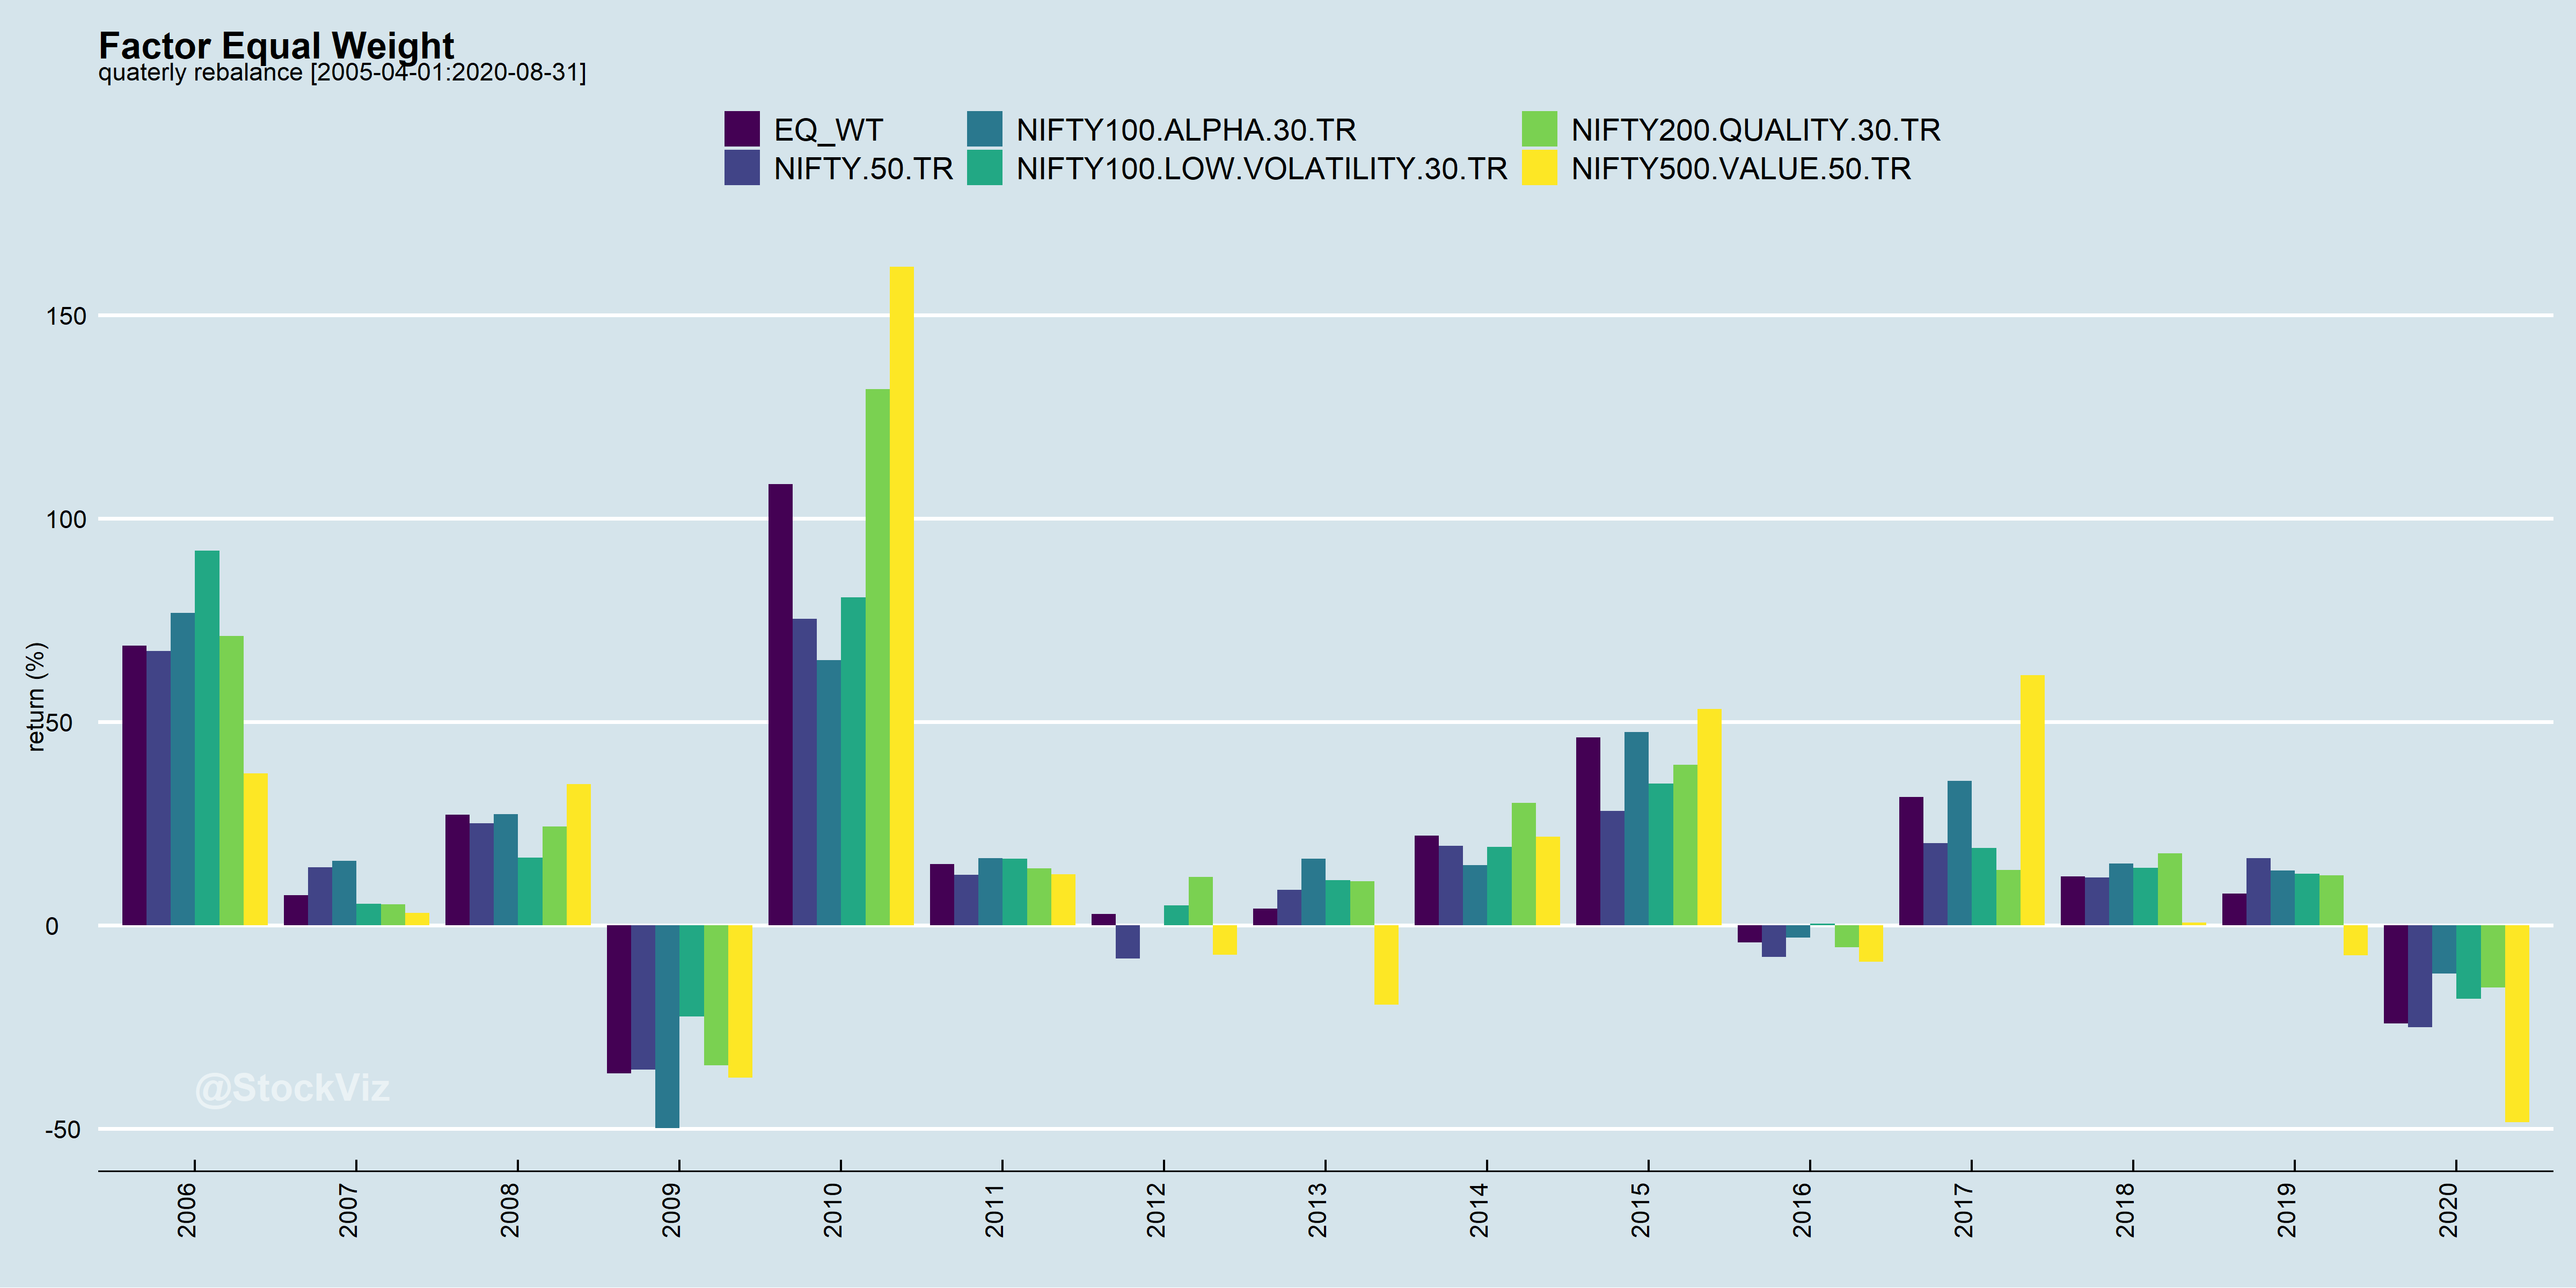
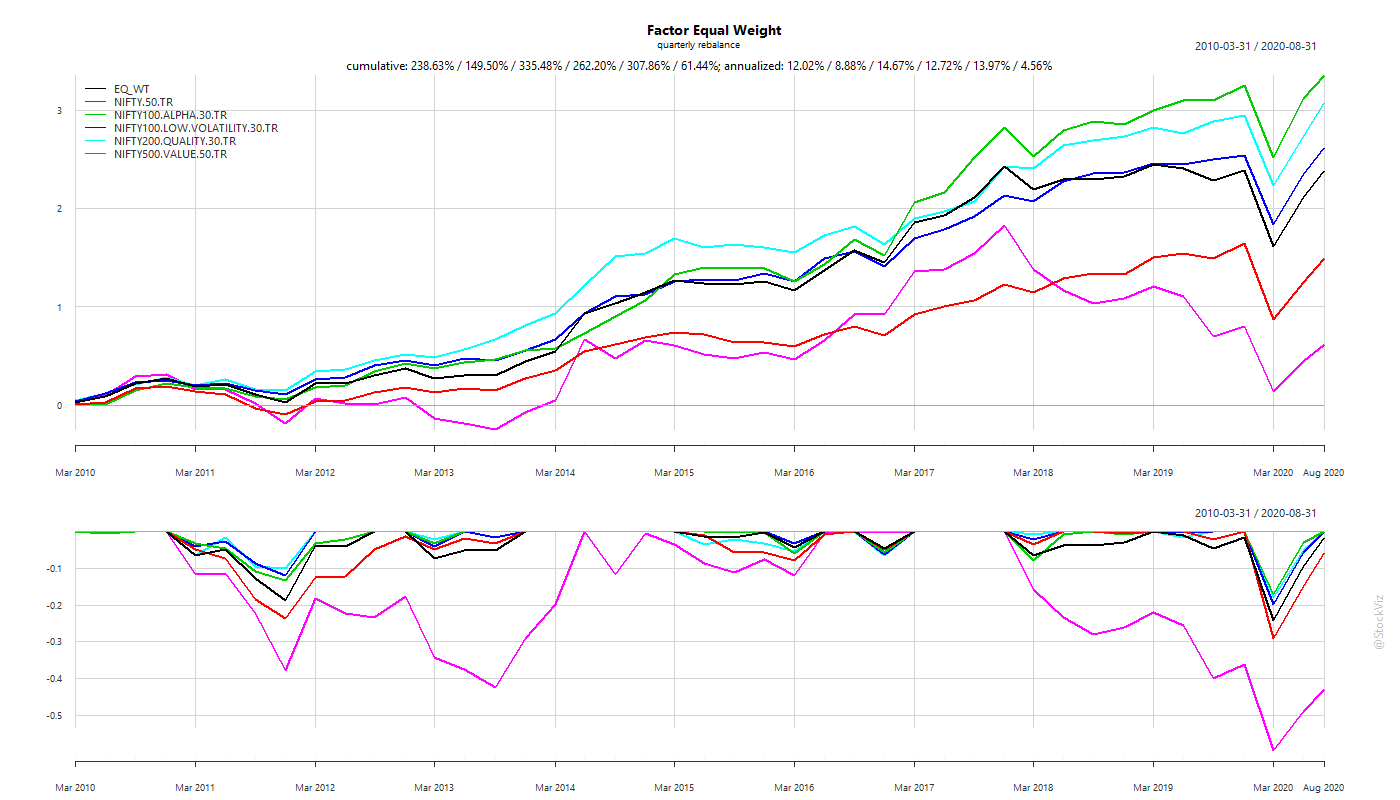
Since 2010, an equal-weight alpha/low-vol/quality/value factor portfolio gave an annualized return of 12% vs. NIFTY 50’s 8.88%.
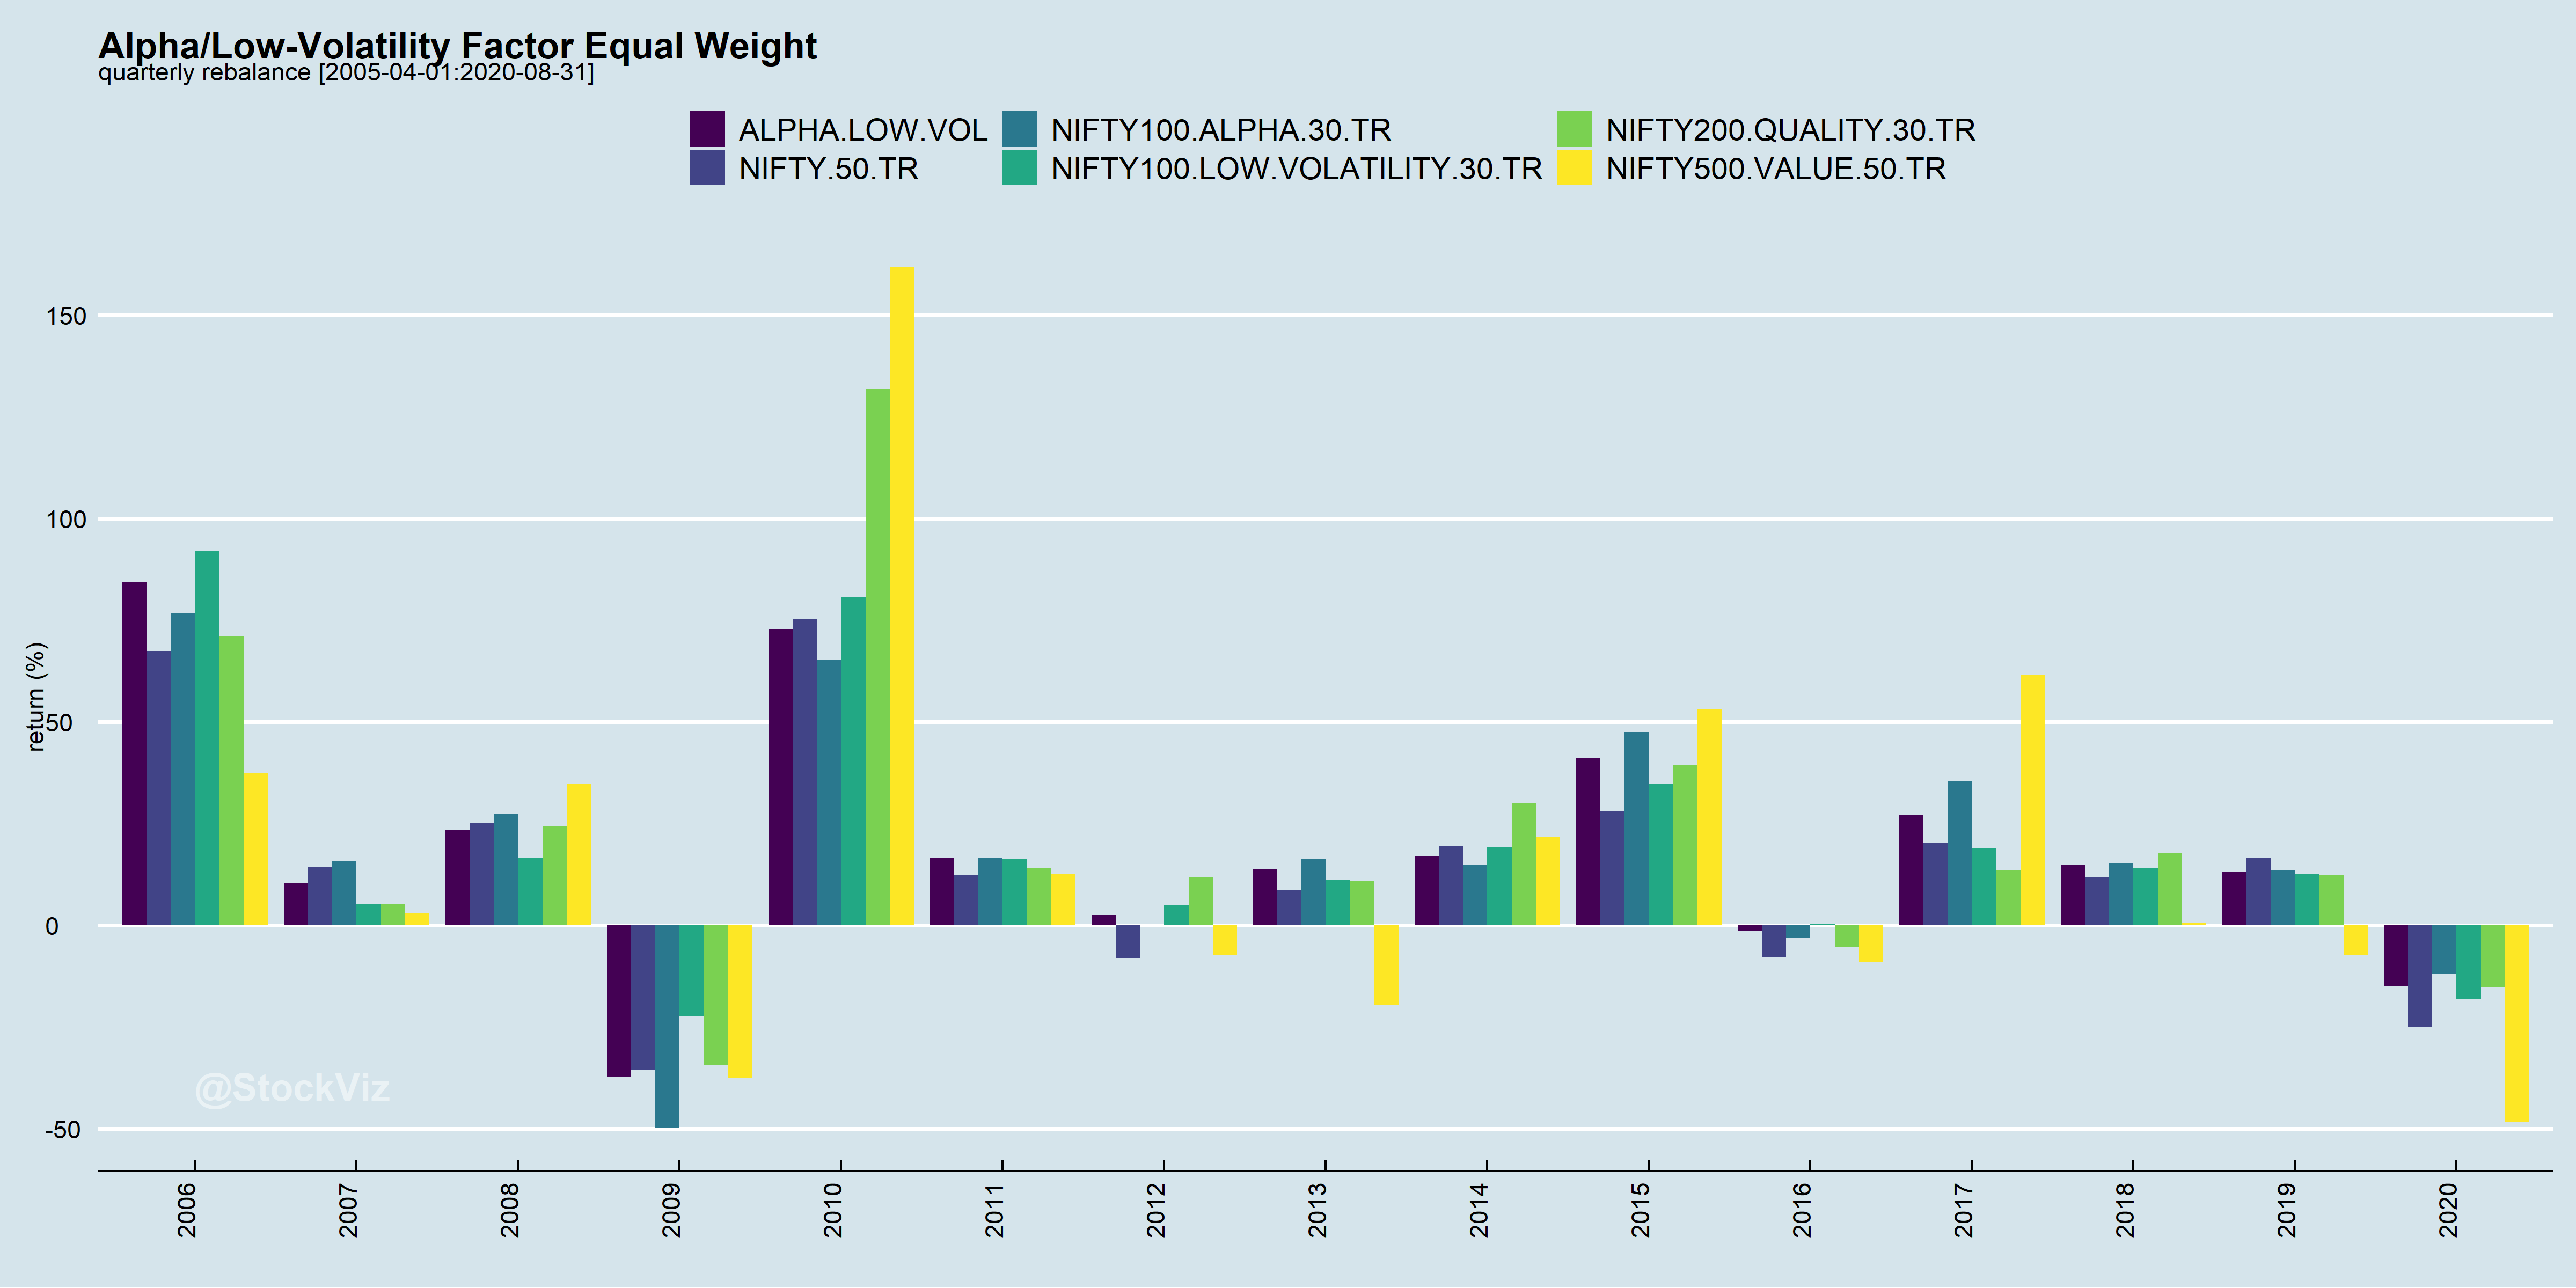
While alpha and low-vol are price-based factors, quality and value are based on company fundamentals. What if, we just equal weighted the price-based factors?
Equal-weighted Alpha and Low-Volatility Factor Portfolio
Given the out-performance of the low-volatility factor, we see a significant boost to an equal weighted alpha/low-vol portfolio compared to equal weighting all the factors.
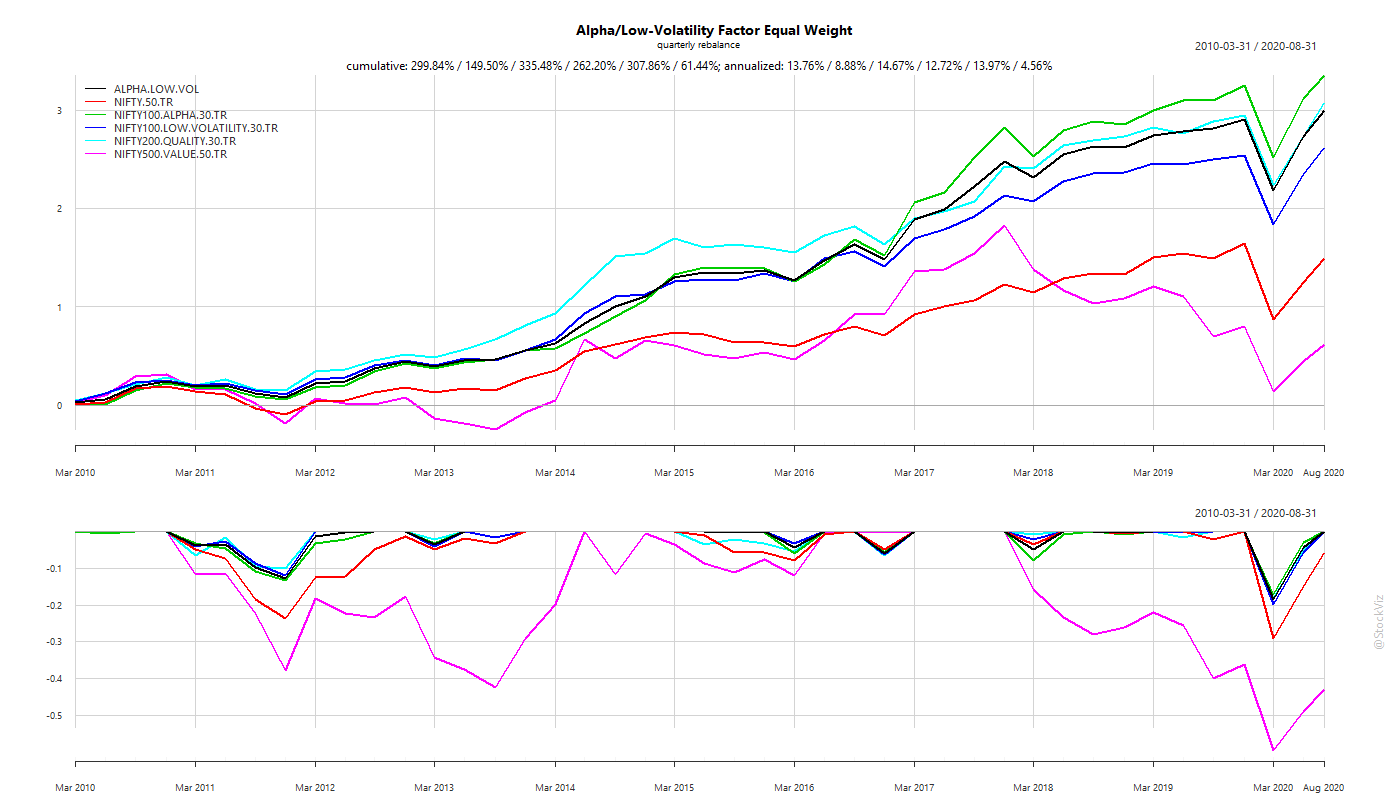
To summarize returns since 2010,
equal-weight all factors: 12.02%
equal-weight only alpha and low-vol: 13.76%
NIFTY 50: 8.88%
Caveats
Before transaction costs, we see that factor indices have beaten the NIFTY 50, historically. However, investors should bear these points in mind while looking at index back-tests:
Index Inception – the date from which the index was constructed (since 2005.)
Launch – the date on which the index was launched (in 2018.)
Invested – the date from which a significant amount of money gets invested in the index (in 2019.)
Re-balance frequency – how often does the index rebalance?
At launch, these indices have incorporated over 13 years of historical data. One can’t discount the possibility that there might be some over-fitting to increase their marketability.
Typically, index performance dips once the AUM crosses a tipping point. And given that India has a 0.1% STT (Securities Transaction Tax,) the higher the re-balance frequency, the worse the performance.
The true test of these indices will occur when real money is invested in them over two or three complete cycles.
Conclusion
Both Factor Rotation and Multi-Factor approaches have their pros and cons. However, the one thing that remains common is that these take time to play-out. There are huge year-over-year variances in performance and investors need to stick to an approach long enough for alpha to emerge.