First, a headline: As U.S. fertility rates collapse, finger-pointing and blame follow (WaPo)
Fact-check: it is true!
Chart from World Bank:
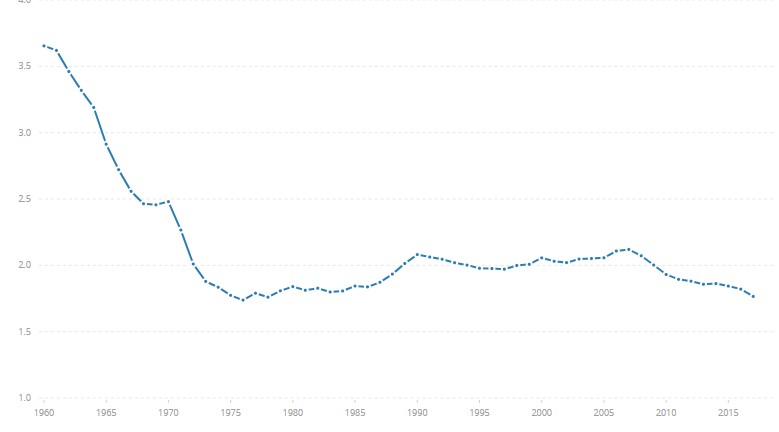
Looks alarming! The government should respond! Mandatory paid maternity and paternity leave! Write-off education loans so that youngsters can afford to start families!
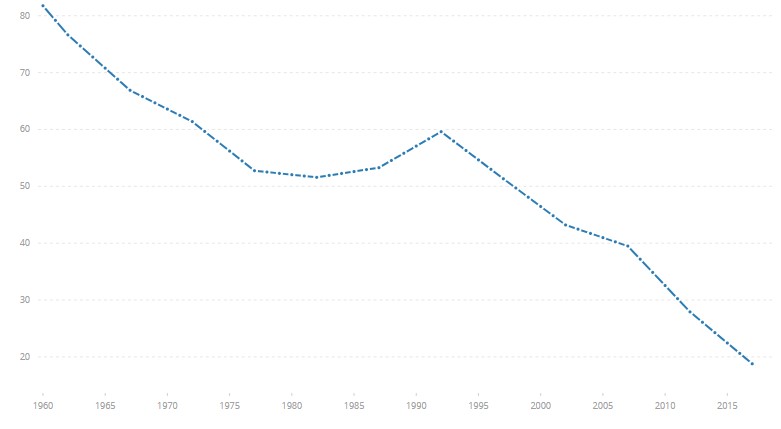
But… could the aggregate reduction in fertility rate be explained by lower teen-pregnancy rate?
And lower infant mortality rates?
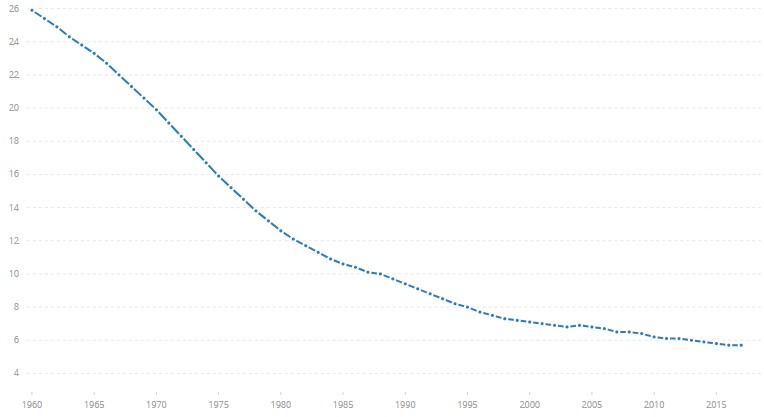
Corrected narrative: women are having lesser kids because they expect all of their kids to make it to adulthood. And are having them later in life. Don’t panic.
Before subscribing to a narrative about a statistic, it is important to first figure out why the statistic was created in the first place. The raw fertility rate statistic was probably created to figure out how many midwifes to train/employ if the trend held up. While the second one was setup to measure the efficacy of sex education in schools and the last one to measure the effectiveness of primary healthcare.
It is only when we go beyond the narrative and seek data that falsifies that narrative that we get the full picture. This is the fundamental difference between hypothesis testing and data-mining.