Definition from StockCharts:
RSI oscillates between zero and 100. Traditionally, and according to Wilder, RSI is considered overbought when above 70 and oversold when below 30.
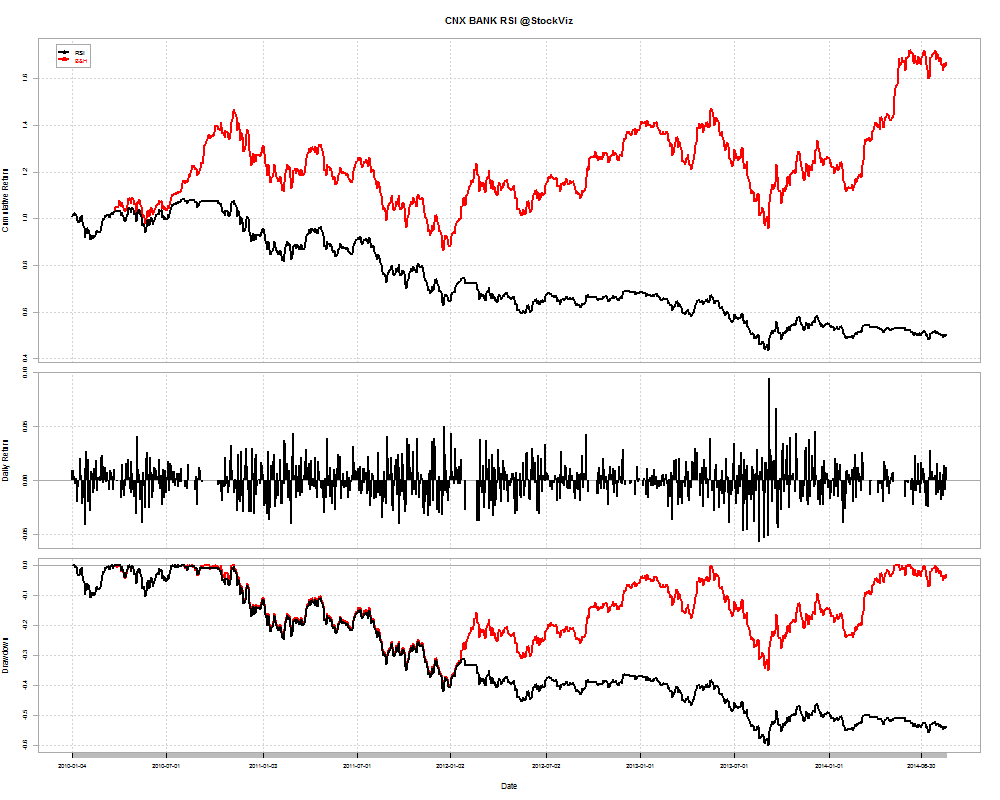
A naive implementation of it would be exit when RSI > 70. Lets see how it worked out vs. a simple buy-and-hold.
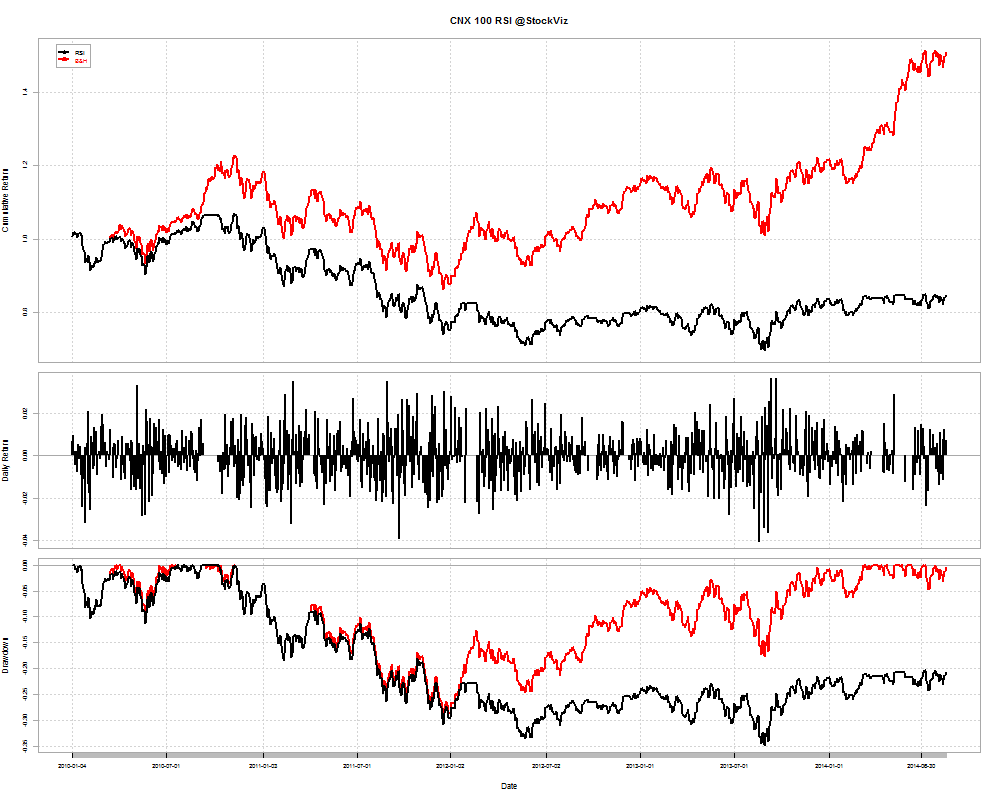
A simple B&H strategy was miles ahead of one that exited the market whenever RSI indicated “overbought.”
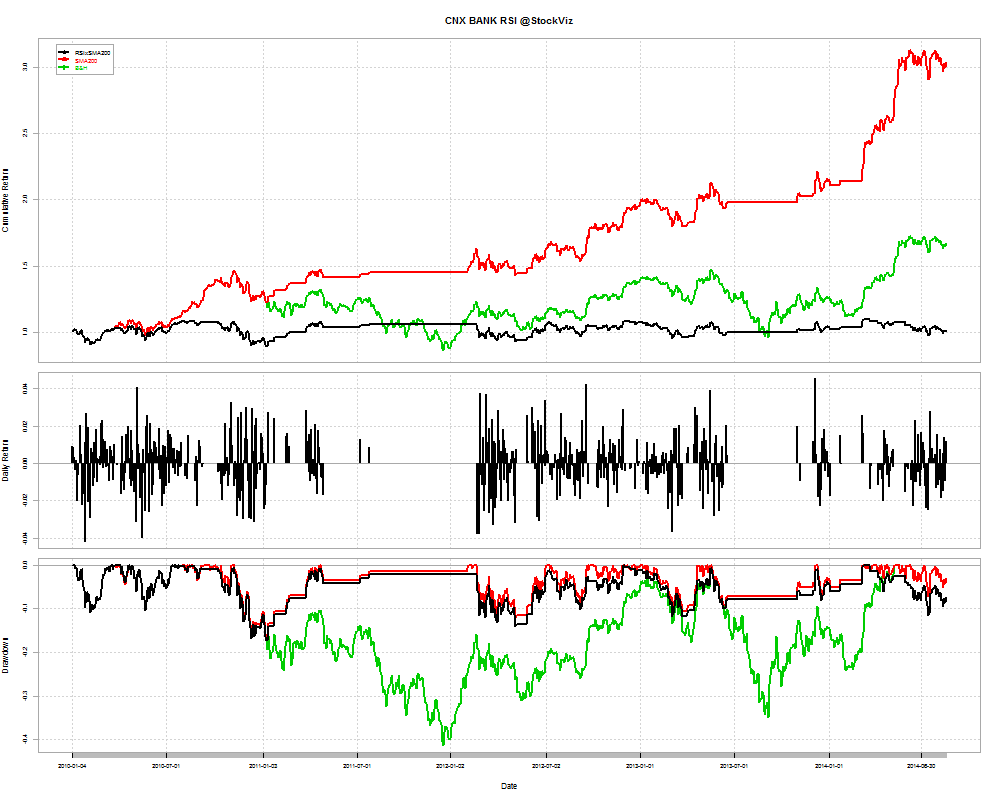
How about being long only when the index is an uptrend (> 200-day SMA) and RSI is not ‘overbought’ (< 70)?
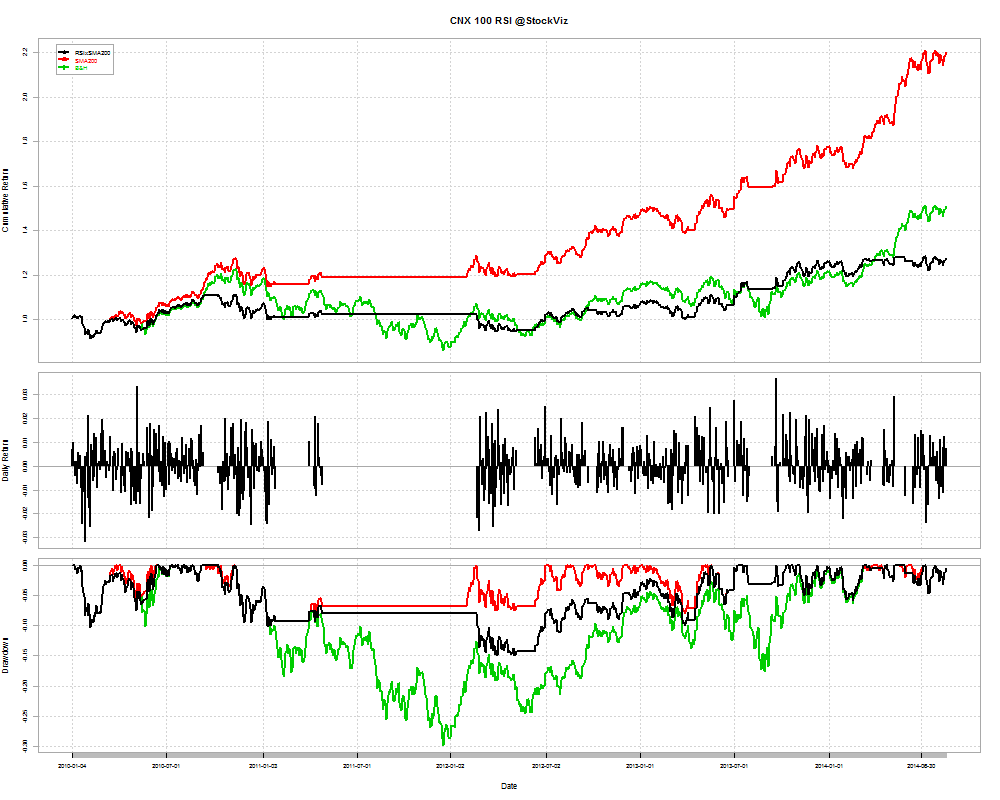
Using RSI was a net negative – it under-performed both a buy-and-hold and a SMA-200 strategy.
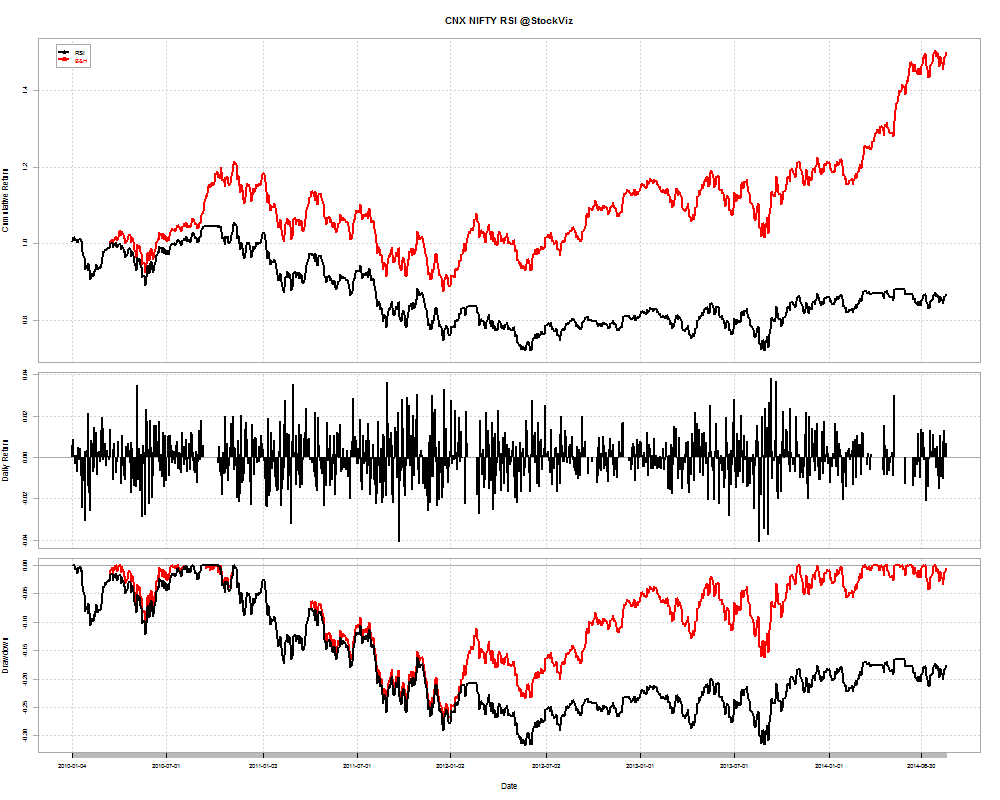
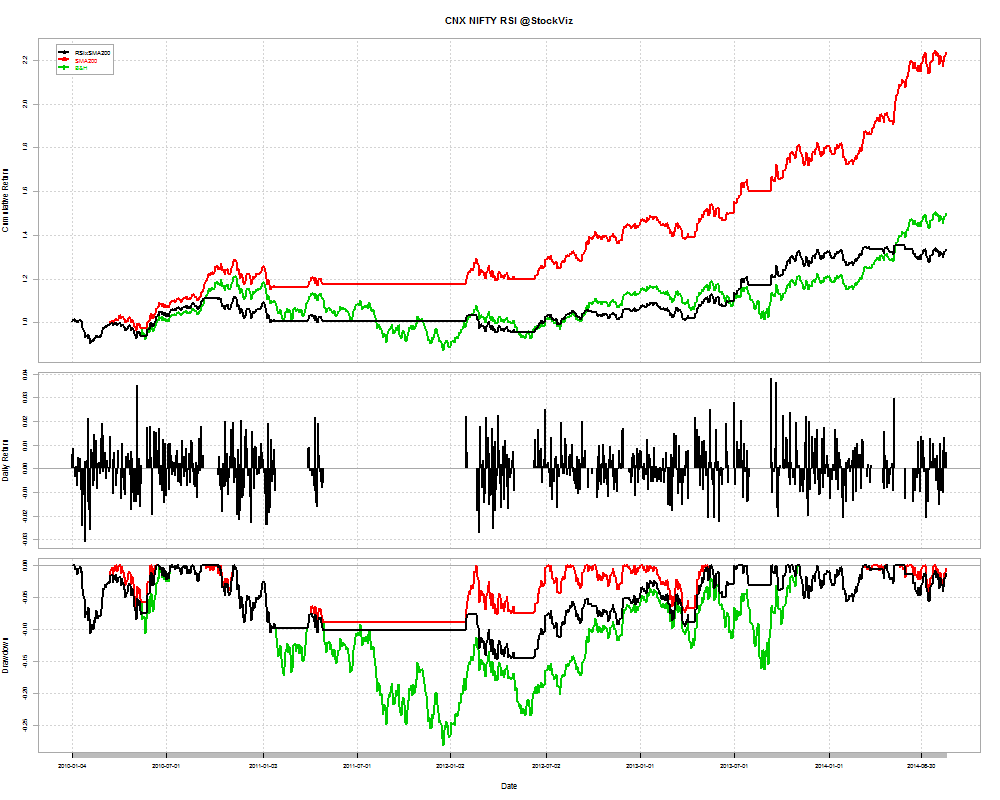
Would it work on other indices?
NIFTY: NO
CNX BANK: NO
Conclusion
The naive RSI strategies described above are money losers. The gains are nowhere near enough to compensate for the losses. A simple buy-and-hold strategy ends up outperforming the RSI.