Continuation of the review of the 4th chapter of John J. Murphy’s Technical Analysis of the Financial Markets (prev.)
Trendlines
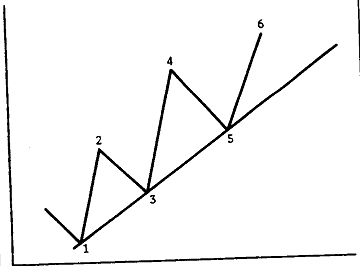 The simplest trendlines are the up trendline: a straight line drawn upward along successive reaction lows. A tentative trendline is initially drawn under the first two consecutively higher lows (points 1 & 3) and then confirmed at the 3rd test (ponit 5). A down trendline is similarly constructed over consecutively lower rally highs.
To draw a trendline:
- The peak at 2 should be penetrated
- 50% retracement of wave 2-3
- Prices approach the top of 2
- Confirmed once prices bounce off the line the third time (point 5)
As long as the trendlines are not violated, it can be used as buying and selling areas. A violation, however, is one of the best early warning of a change in trend. The longer the trend and the number of times it has been tested, the more its importance. Once a reversal occurs, what was once an up trendline, now acts as a resistance barrier for subsequent rallies. And what was once a down trendline, acts as support.
Up Next: The Fan Principle
