This is a review of the third chapter of John J. Murphy’s Technical Analysis of the Financial Markets.
Chart Construction
The daily bar chart is the most commonly used chart amongst technical analysts. It’s called a bar chart because each each day’s range is represented as a vertical bar. 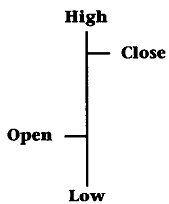
StockViz uses a variation of the bar chart called the candlesticks. These charts can be constructed for any time period. For example, one line can represent an entire week’s action with the High Low Open Close representing the week’s price movements instead of a day’s.
We have covered candlesticks before, it would be worth the effort to have a brief look at it before proceeding to the next chapter.
Up next: Trend Spotting
