Image via Wikipedia
Every company is different, they have their own culture, target market, processes, etc. In order to have a make relative value comparisons between them, it is useful to have a common set of metrics. Here are some of the key numbers and rations:
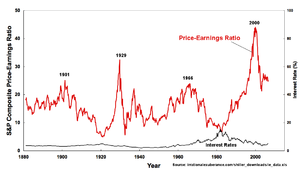
- PE Ratio: the Price-to-Earnings Ratio simply divides the stock’s price by its earnings per share. It basically shows what investors are willing to pay for each Rupee of the company’s earnings. In inverse ratio: Earnings Yield indicates how much the company yielded in earnings for each invested dollar.
- PB Ratio: the Price-to-Book Ratio divides the stock’s price by its net assets (less any intangibles like goodwill.) It basically indicates what investors are willing to pay for each Rupee of a company’s tangible assets.
- Free Cash Flow: FCF tells the investor how much cash the company is left with after capital investments.
- PEG Ratio: Price/Earnings to Growth ratio is a modified version of the PE ratio that takes the growth of the company into account. It is calculated by dividing the P/E ratio by the expected earnings growth rate in %.
So what would be an ideal investment? To get you started, you should aim for a PB < 1.5, a positive and growing FCF and PEG <= 1.0. Use the PE as a guide to compare a stock with industry peers. You can use our screener to shortlist stocks that meet your investment needs.
Remember: these metrics are only snapshots of a firm at a point in time. As an investor, you should look at how these numbers have evolved over time for a company. More on this later.

Comments are closed, but trackbacks and pingbacks are open.