Tag: technical analysis

RSI through a Support Vector Machine, Part Deux

Yesterday, we asked a question: How would an SVM (Support Vector Machine) train if we gave it a 14-day RSI and 50-day SMA of the Nifty index? The goal was to use the SVM to first see if it can figure out a relationship between RSI and NIFTY and then check if we can turn that into a set of trading rules.

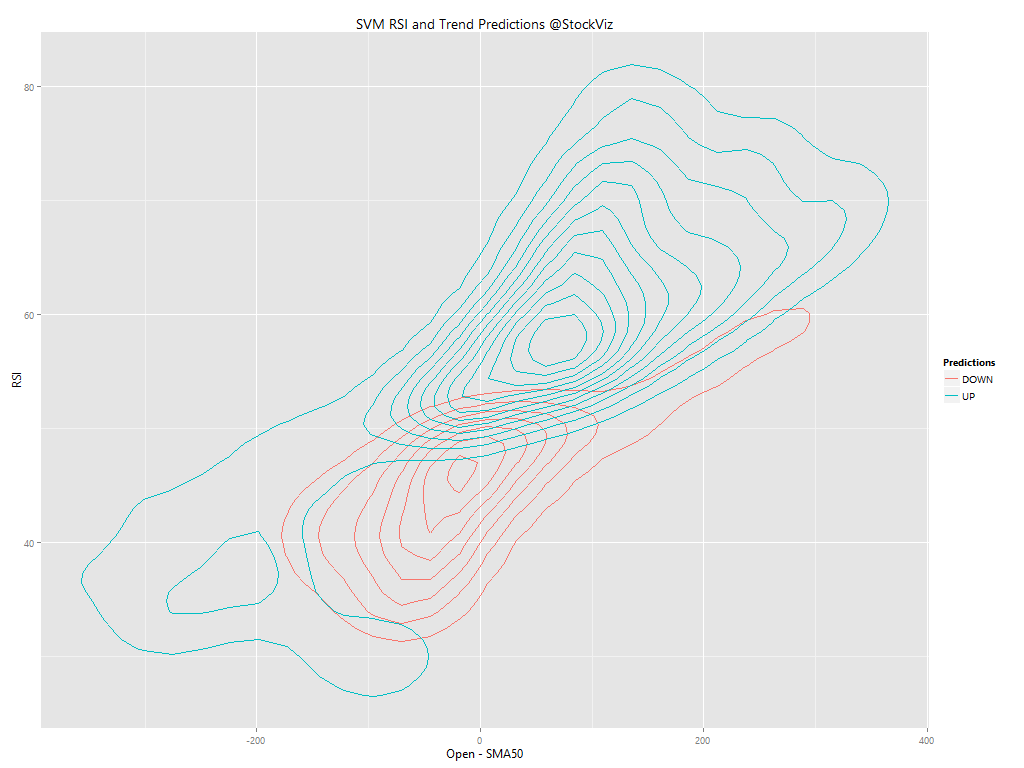
If you look at the predictions that the SVM gave for 2006, you can see two distinct areas where it went short (red contours) and where it went long (blue contours.) But the funny thing is, it went long when RSI > 50 (when the market is supposed to be overbought) and short when RSI < 40 (supposed to be oversold.)

svm-rsi-nifty-2006

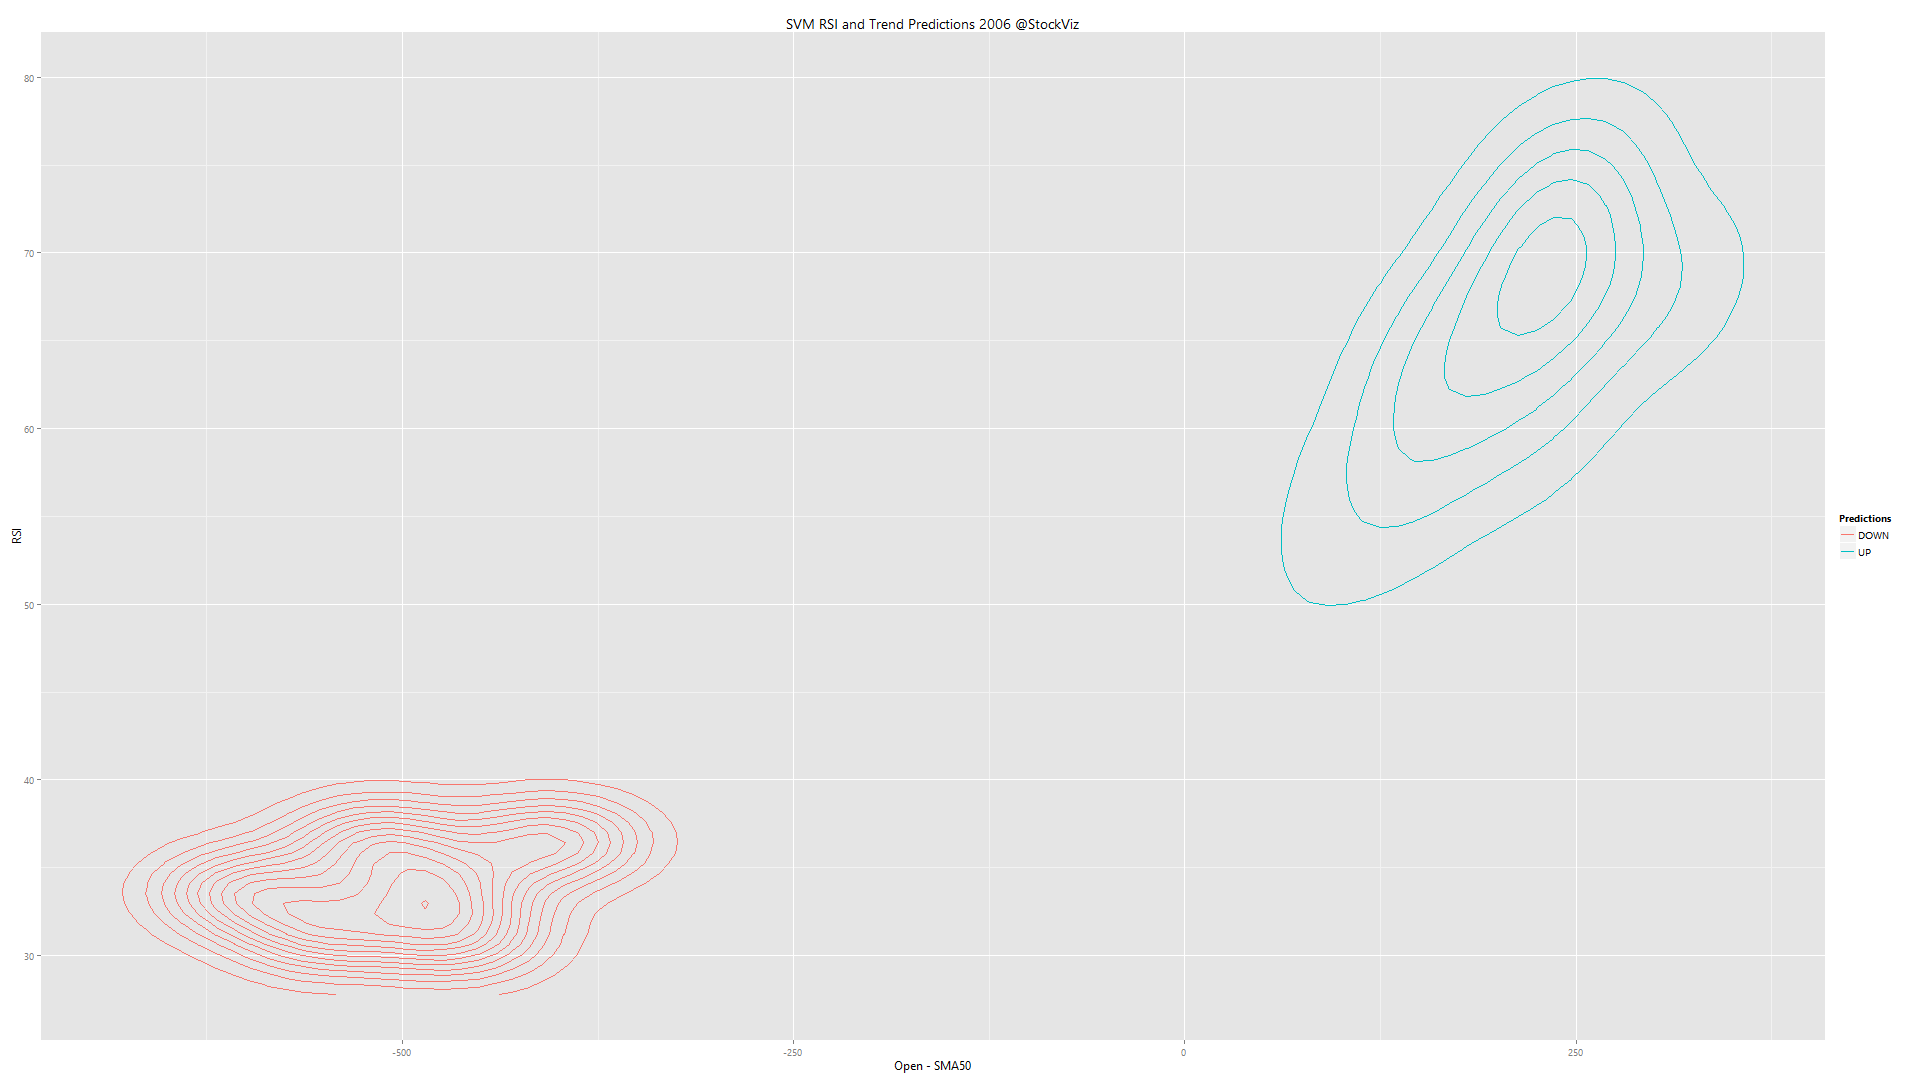
The kicker is that it followed the trend (x-axis) more than RSI (y-axis). In terms of predictive power, trend seems to be way more powerful than RSI, at least for the year 2006.

To check if we can actually setup any trading rules (trend x RSI = 4 combinations for buy/sell), we ran yearly training data through an SVM to check if there were any stable relationships. Here’s the video:

The contours change year to year, with little stability between them. Basically, a trading strategy based on RSI is going to be random.

Related: Using SMA to Reduce Volatility of Returns

Mangling RSI through a Support Vector Machine

Conventional wisdom has it that RSI values over 70 to represent overbought market conditions and under 30 to represent oversold market conditions. But where did these numbers, 70 and 30, come from? We already tested two naive RSI strategies that bombed spectacularly. We were curious as to what an SVM (Support Vector Machine) would do if we gave it a 14 day RSI and 50-day SMA of the Nifty index. This is what came out of it:

svm-rsi-nifty

The bifurcation between long and short is pretty well defined. And is seems that trend overshadows RSI. Is RSI even relevant?

Two Relative Strength Index (RSI) Strategies that Do Not Work

Definition from StockCharts:

RSI oscillates between zero and 100. Traditionally, and according to Wilder, RSI is considered overbought when above 70 and oversold when below 30.

A naive implementation of it would be exit when RSI > 70. Lets see how it worked out vs. a simple buy-and-hold.

CNX 100-RSI-returns-2010

A simple B&H strategy was miles ahead of one that exited the market whenever RSI indicated “overbought.”

How about being long only when the index is an uptrend (> 200-day SMA) and RSI is not ‘overbought’ (< 70)?

CNX 100-RSIxSMA-returns-2010

Using RSI was a net negative – it under-performed both a buy-and-hold and a SMA-200 strategy.

Would it work on other indices?

NIFTY: NO

CNX NIFTY-RSI-returns-2010

CNX NIFTY-RSIxSMA-returns-2010

CNX BANK: NO

CNX BANK-RSI-returns-2010

CNX BANK-RSIxSMA-returns-2010

Conclusion

The naive RSI strategies described above are money losers. The gains are nowhere near enough to compensate for the losses. A simple buy-and-hold strategy ends up outperforming the RSI.

93 Technical Indicators that don’t Predict Market Returns

There’s a research paper out that looks at 93 common technical indicators and concludes that they have no predictive power whatsoever:

We review the predictability of a wide range of 93 technical market indicators in predicting the S&P 500 returns. This adds to the literature with evidence from widely used but less examined market indicators, to more conclusively answer the question of whether technical analysis is useful or not. Overall, we do not find the market indicators generate profits that beat the buy and hold strategy. This result does not change if we consider the possibility of regime-switching predictability on business cycles or sentiment cycles. Moreover, our results remain robust if we use a GARCH (1,1) or robust regression method.

Source: Technical Market Indicators: An Overview

Related: Technical Analysis

Post-hoc Technical Analysis

Michael Harris over at Price Action Lab:

Saying that “if these levels hold prices will rise and if they do not, prices will fall”, is a statement that confuses event order. Price moves first and then we decide whether some level or indicator was violated. If a level does not hold, it is because price already moved below it or above it. It is not the other way around.
 
In technical analysis, use of any derivative of price, including support and resistance levels, indicators or patterns, is often useless, unless there is a measure of the probability of some event. Otherwise, just describing these levels is either only stating the facts or it is naive analysis due to ignorance.

Source: Technical Analysts Who Have Their Cake and Eat it Too

Related: