Tag: gold

Allocating a Four-Asset Portfolio

Our previous posts showed how various allocation decisions impact optimized and equal-weighted three-asset portfolios. Here, we add a fourth asset – gold – and run it through the same scenarios.

Picking the Assets and Allocation

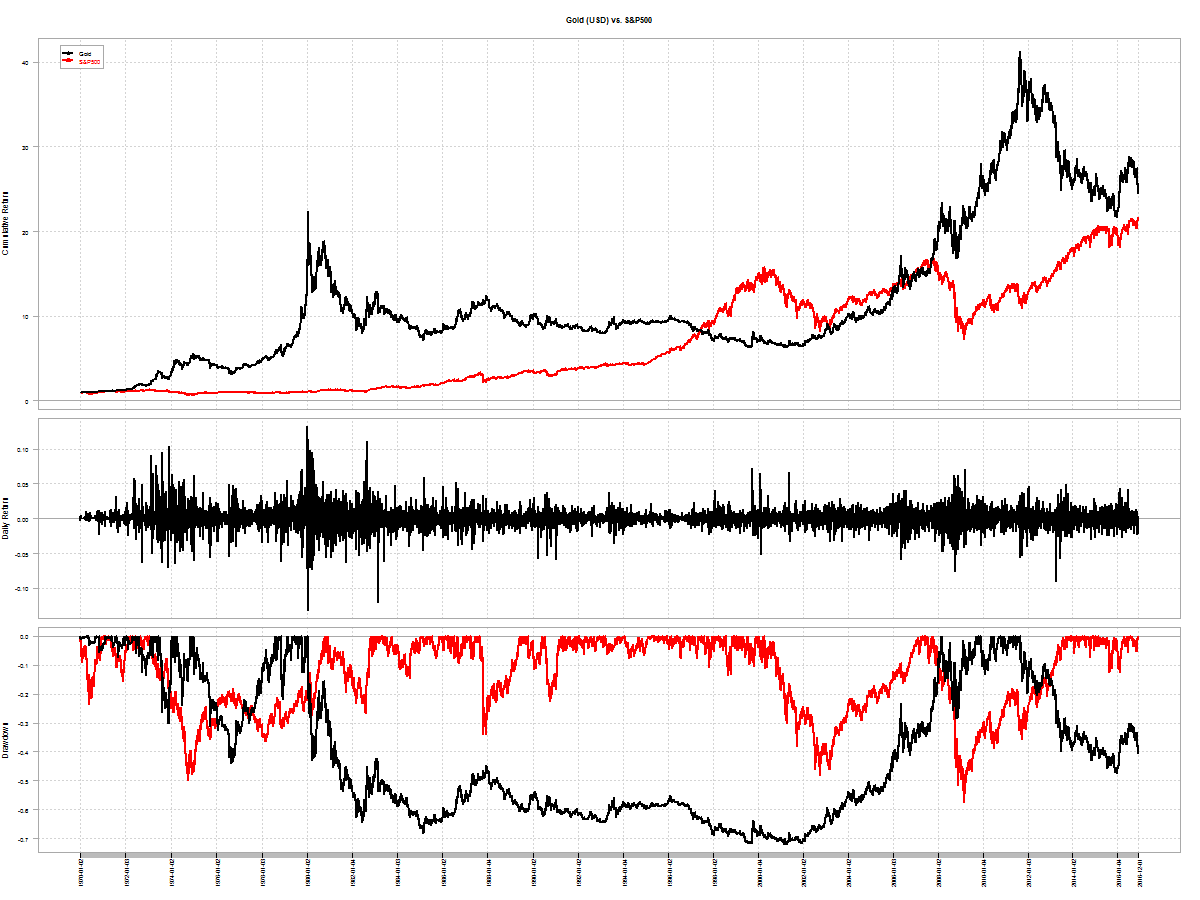
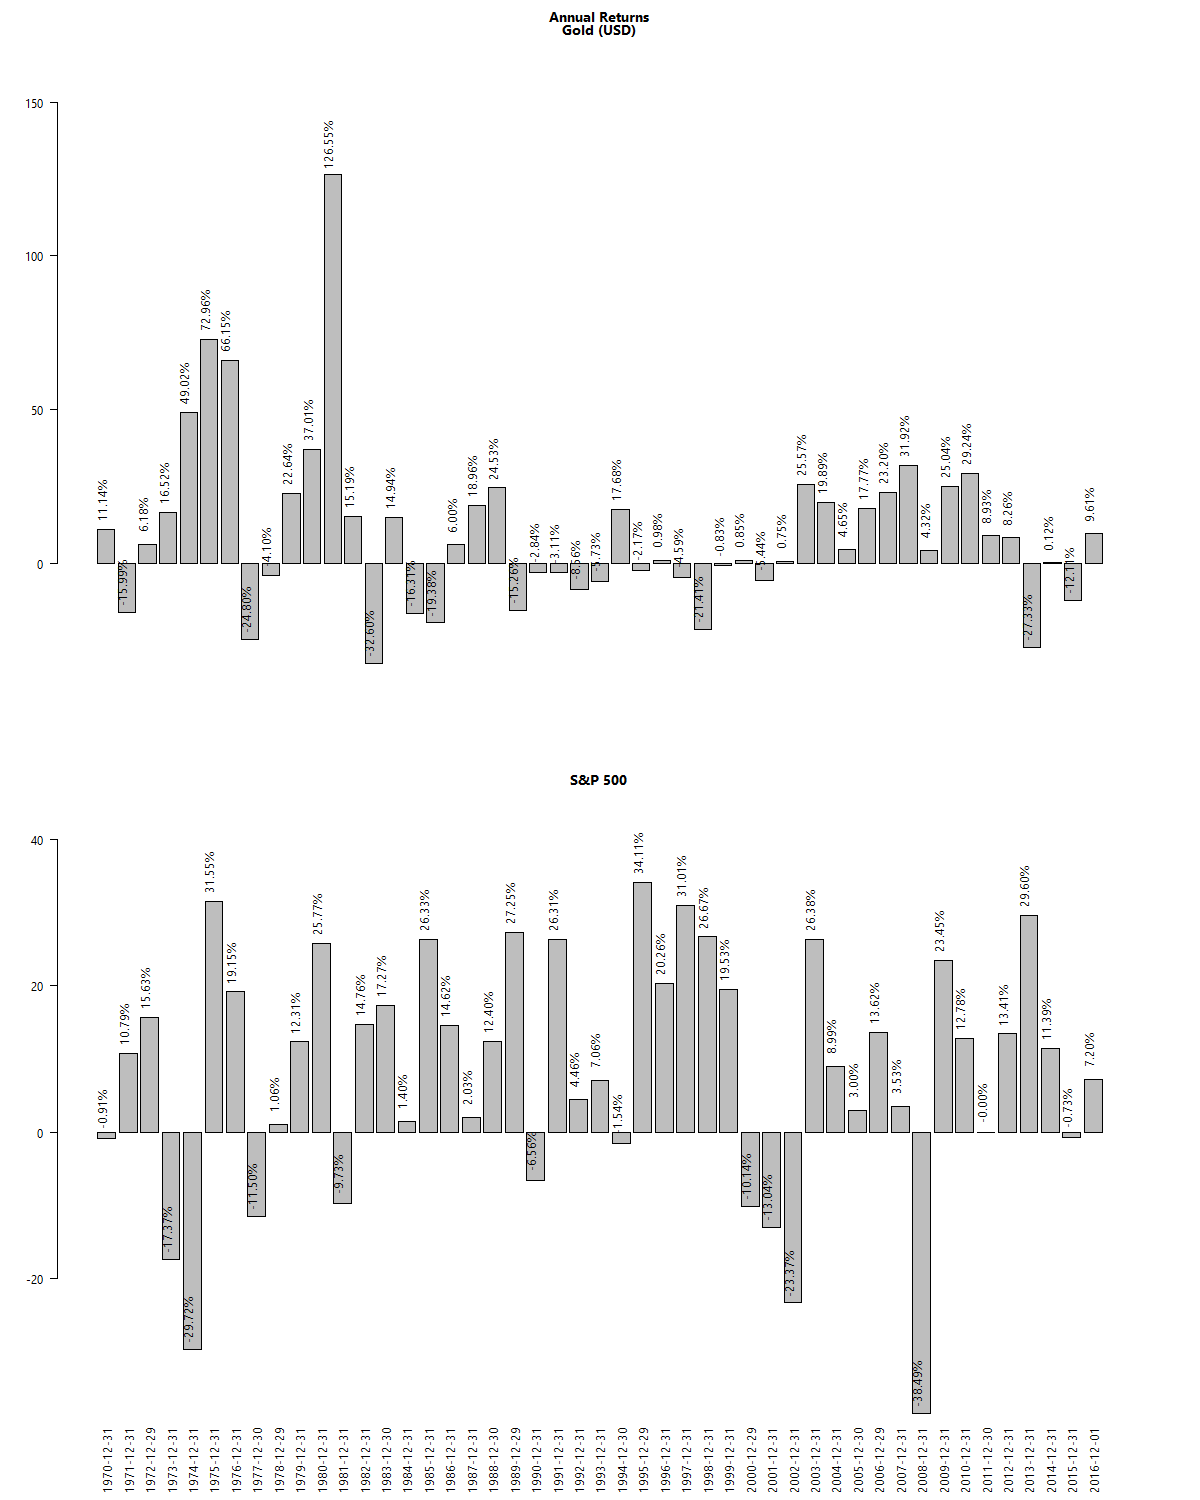
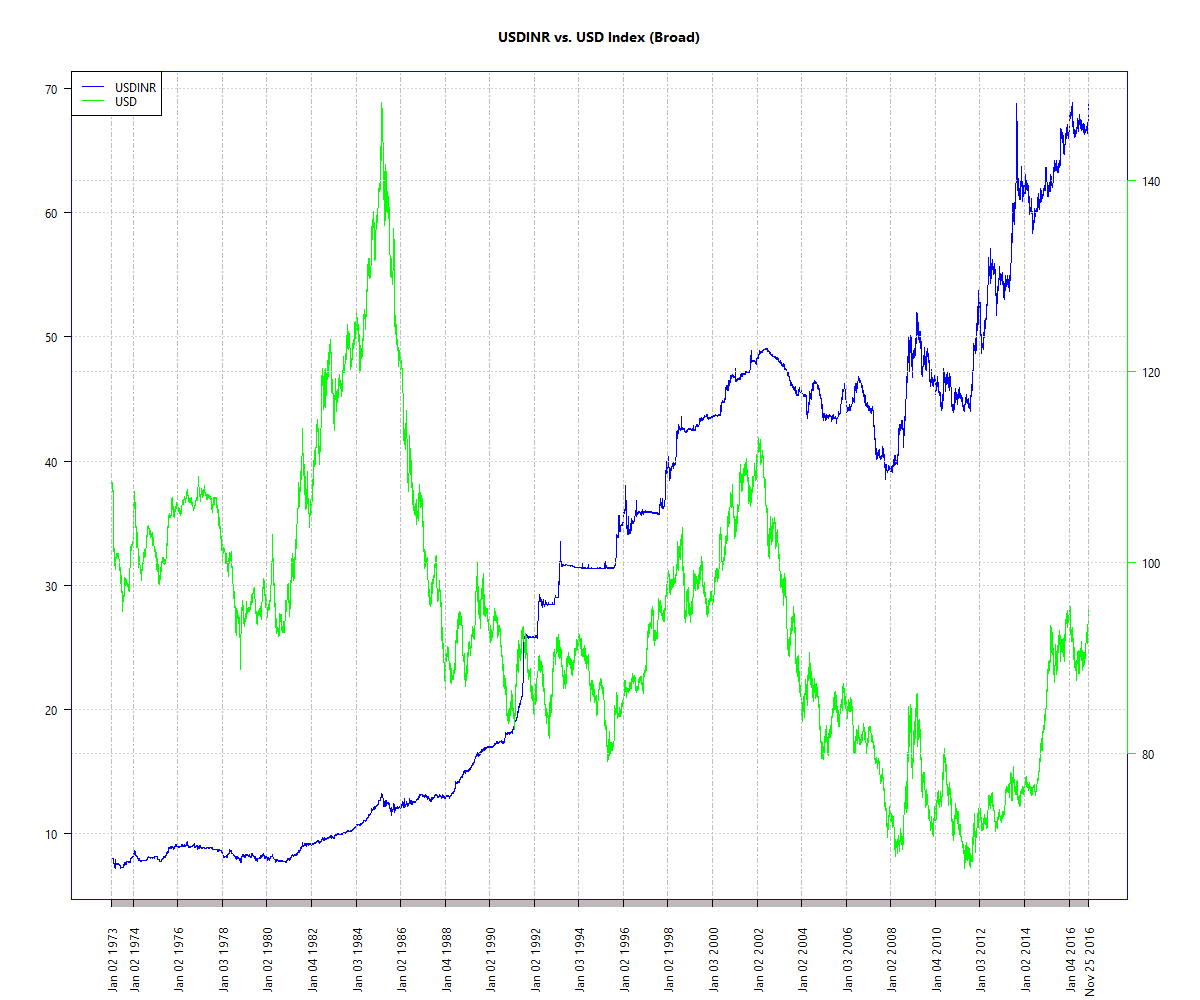
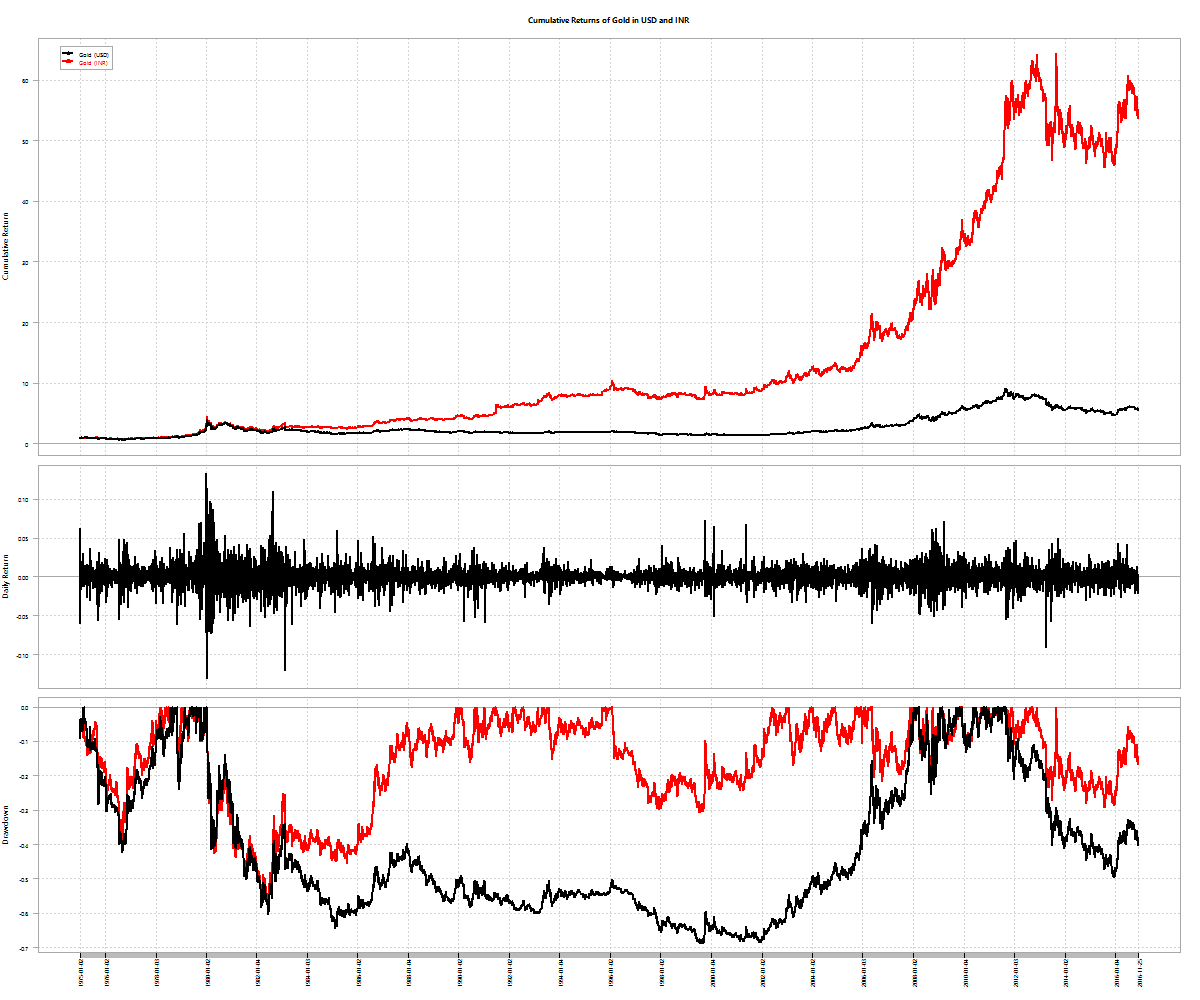
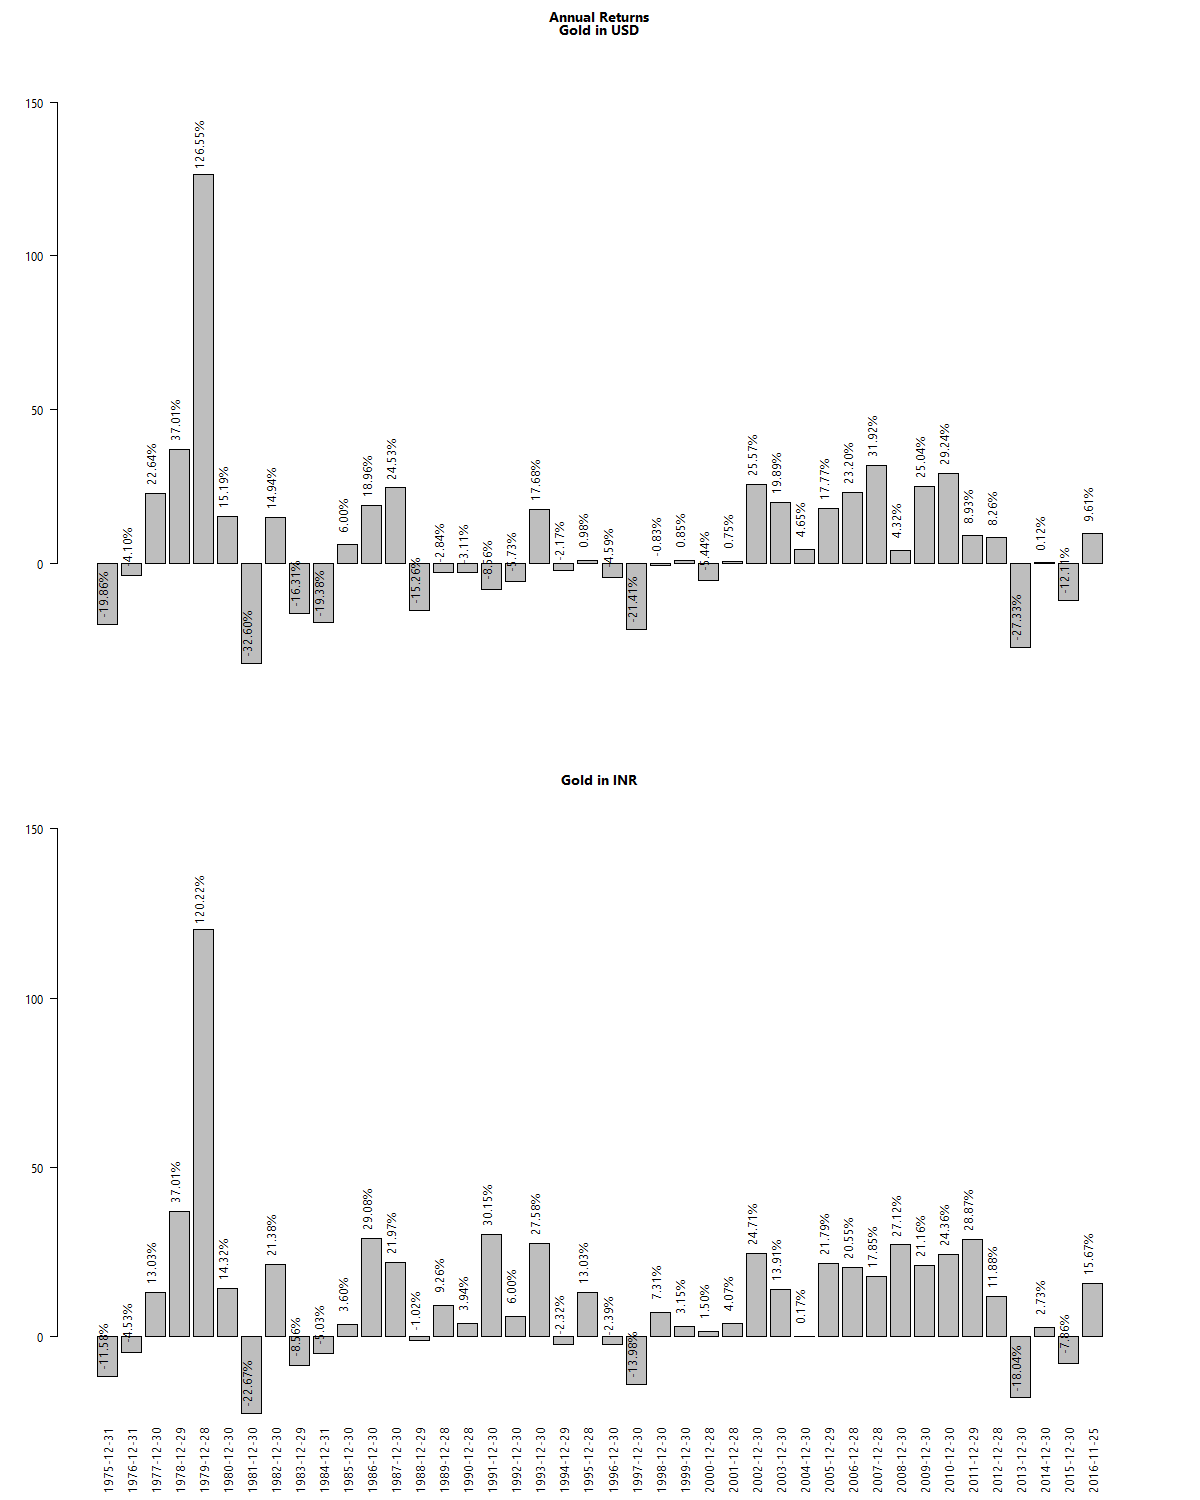
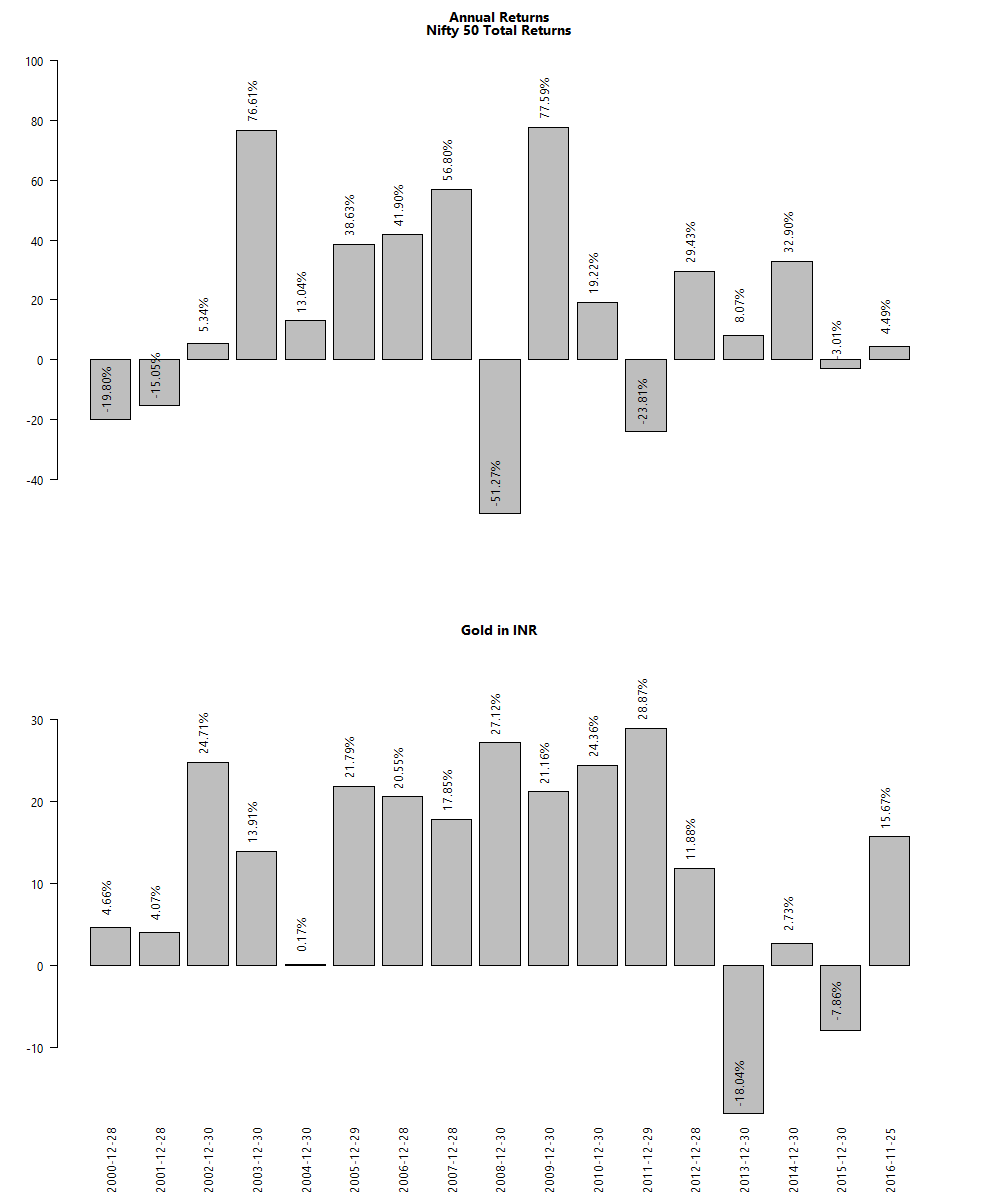
The assets we selected previously – MIDCAP, 0-5yr bond and NASDAQ-100 – were based on low observed historical pair-wise correlations. Most investors tend to add a fourth asset – gold – to their portfolios. Not only is gold not correlated with the other three, it has the added benefit of being priced internationally but traded locally. This allows it to benefit from rupee depreciation even if international gold prices remain flat. Observe how, at times, gold has a negative correlation to other assets:
correlations between gold, SPY, QQQ, MIDCAP and BONDs

The results

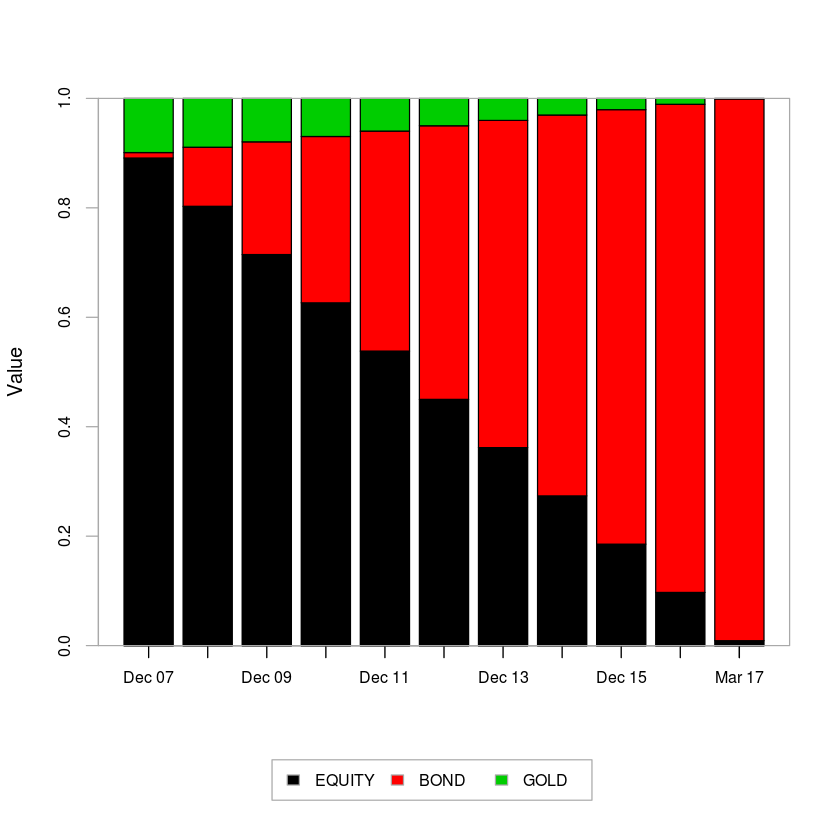
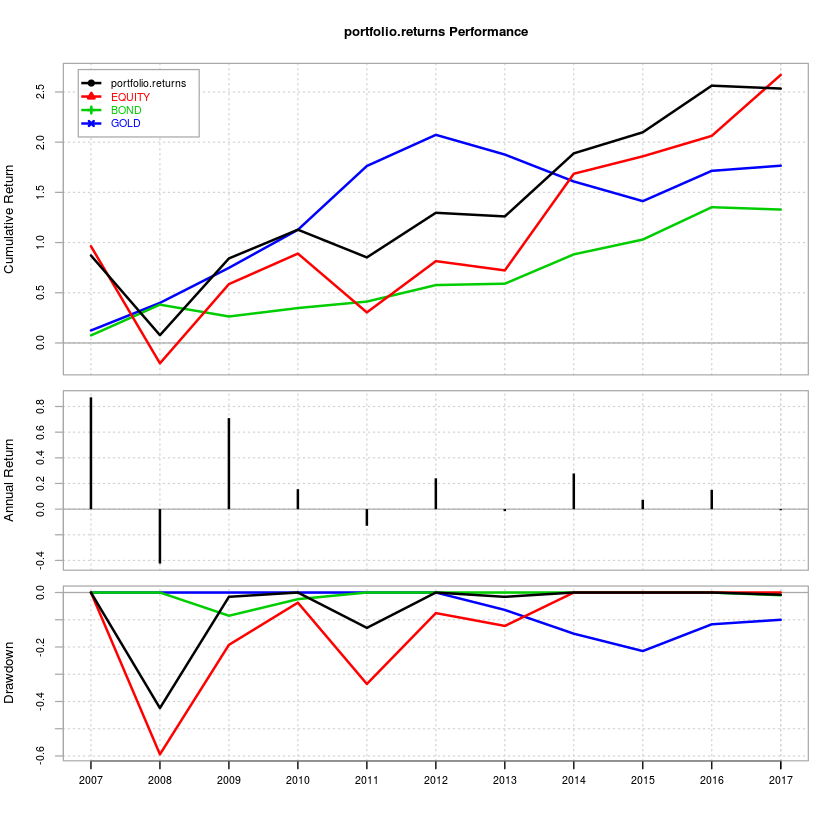
In the cumulative return and drawdown chart below, A1 is the MIDCAP index, A2 is the 0-5yr bond index, A3 is the QQQ and A4 is gold. A tax drag of 10% and an STT of 0.1% is applied at every rebalance. The rebalance threshold is set at 20%. The light-blue lines are the resulting portfolio returns. In the case of optimized portfolios, assets are allowed to have a weighting between 10% and 40% during the optimization process.

Equal Weighted

after tax cumulative returns of 4-asset equal weighted portfolio

Variance optimized

after tax cumulative returns of 4-asset variance optimized portfolio

Expected Tail Loss optimized

after tax cumulative returns of 4-asset ETL optimzied portfolio

Pre- and Post-tax returns

before and after tax cumulative returns of 4-asset equal weighted portfolio
before and after tax cumulative returns of 4-asset variance optimized portfolio
before and after tax cumulative returns of 4-asset ETL optimized portfolio

Rebalance

The rebalance threshold ends up determining the frequency of rebalance events. For a variance optimized portfolio, contrast the difference between a 20% threshold and an 80% threshold:

4-asset portfolio at a 20% rebalance threshold
4-asset portfolio at a 80% rebalance threshold

Take-away

  1. Every time there is a rebalance, the tax-man cometh and taketh away. Trying to minimize taxes is equivalent to minimizing the number of rebalancing events.
  2. To minimize reblancing events, one could set the threshold of rebalance higher. But there is a point of inflection with regards to after-tax returns.
  3. Allowing a single asset to balloon in weight risks larger portfolio drawdowns if that asset deflates.
  4. A four-asset equal weight portfolio under-performs a 3-asset equal weight portfolio. Gold maybe a good diversifier, but it doesn’t appear to do any favors to the portfolio on the performance front.
  5. Equal-weight 4-asset portfolio containing gold (above) drew-down less than the equal-weight 3-asset portfolio during the 2008 carnage (~30% vs. ~40%, respectively.)

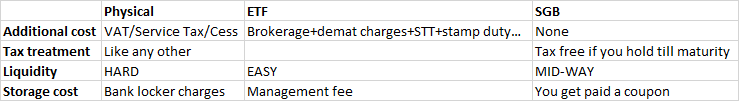
Adding gold to a portfolio does not look like a good idea when looked through the lens of asset allocation schemes discussed here. However, there is a strong case for owning gold and the Sovereign Gold Bond (SGB) Scheme makes a lot of sense. See our previous post regarding the case for owning gold in India here.

Code, charts and the complete result dataset are available on github.

An Equity, Bond and Gold Portfolio

How did diversification across Midcap equity, bonds and gold work out for Indian investors over the last 10 years? Not too shabby, as it turns out:

Combined portfolio – Annualized: 12.16%; Max drawdown: -42.42%
Gold only portfolio – Annualized: 9.69%; Max drawdown: -21.49%
Equity only portfolio – Annualized: 12.55%; Max drawdown: -59.39%
Bond only portfolio – Annualized: 7.99%; Max drawdown: -8.52%
*Not including transaction charges/taxes.

The Setup

  • Annual rebalance.
  • Bonds start at 1%, the rest is divided between Gold (10%) and Equities.
  • The total return index for the 5-10 year tenure published by CCIL is used as a proxy for Bonds.
  • The MID100 FREE index is used as a proxy for Equities.
  • The GOLDBEES ETF is used as a proxy for Gold.
  • Period under observation: 2007-04-01 through 2017-03-31.

The idea is that you start with mostly Equity and Gold in the portfolio and rebalance at the end of every year so that at the end of 10 years, you end up with mostly Bonds.

Returns

Notice the drawdown of the equity vs. that of the portfolio. You end up with similar returns but with lower volatility.

If you remove Gold from the equation and go with only Equity and Bonds:

Combined portfolio – Annualized: 11.38%; Max drawdown: -49.90%
Equity only portfolio – Annualized: 12.55%; Max drawdown: -59.39%
Bond only portfolio – Annualized: 7.99%; Max drawdown: -8.52%

Even though a diversified, rebalanced portfolio makes sense on the surface, the tax treatment on Gold and Bonds make an annual rebalance an expensive affair.

Code and detailed results are on Github.

Investing in Gold

The almighty dollar

Although India and China account for a bulk of world gold consumption, the price of gold continues to be set in London and New York. When you buy gold in India, you are exposed to two things:

  1. The dollar price of gold.
  2. The USD/INR exchange rate.

Even at times when the price of gold goes down in dollar terms, if the rupee goes down more, then you still have a profit in your hands. This partly explains why Indians are crazy about gold – it is the easiest way to get short the rupee.

Dollar returns of gold

If you look at the returns of the S&P 500 vs. gold since 1970’s, gold comes out a winner.

gold-sp500-usd

Not to say that it was easy to own. Gold peaked in the 80’s and remained out of favor till 2008!

gold-sp500-usd-annual

Rupee depreciation

The dollar returns of gold is only a small part of the story. The bigger picture here is that of rupee depreciation. Let us see how USDINR compares with USD vs. a board basket of currencies:

inr-usd

See the blue line? That is how much the US Dollar has appreciated against the rupee. The green line is the dollar vs. other currencies with which America does business with.

With this in mind, let’s compare the returns from gold in USD vs. gold in INR:

gold-inr-usd-cumulative

Notice the troughs of Gold/INR is shallower than those of Gold/USD?

gold-inr-usd

When you have a depreciating currency in hand, you can’t get rid of it fast enough. And the easiest way to do that in India is to buy gold. Our government can’t print more of it, can’t set its price and is fairly liquid.

Gold vs. NIFTY50

Since 2000, Rupee-for-rupee, gold had given better returns than the NIFTY 50.

gold-inr-nifty-cumulative

It is only the recent under-performance that has the anti-gold lobby all fired up.

gold-inr-nifty

The long arch of the depreciating rupee is a more powerful force than what equity-only investors will have you believe.

Ways to invest in gold

Until recently, the only way to buy gold was to buy physical gold. However that is a very expensive proposition. Then came the gold ETF – GOLDBEES – that allowed investors to hold paper gold in demat form and provided instant liquidity. This year, the government came out with Sovereign Gold Bonds that is pretty good alternative. Here’s a handy table that looks at different aspects:

goldbond

SGBs not only pay the price of gold at maturity but actually pay the investors an annual coupon. Currently, investors get 2.5% on their investment in SGBs. Contrast this to gold ETFs where investors have to pay asset management fees to the the fund house. From an asset allocation perspective, SGBs are a better deal than Gold ETFs. Go with gold bonds!

Should you go contrarian on Gold?

This time, last year, almost all believed the metal would rise through the year. Analysts issued an average price forecast of $1,753 per troy ounce. Instead, gold averaged $1,411, suffering its first down year in 13 and worst year since 1981. By New Year’s eve the price was $1,202.

Gold ETF (USD):

Gold ETF (INR):

GOLDBEES

Investment demand for physical gold fell 25% last year. ETFs that keep gold in vaults on behalf of investors have dumped nearly 30m ounces from a high of 84.6m ounces at the end of 2012.

Currie, Goldman Sachs’s head of commodities research, had a target of $1,050 an ounce back in early October. The biggest gold bulls have abandoned ship. Paulson told clients at his firm’s annual meeting Nov. 20 that he personally wouldn’t invest more money in his gold fund. Billionaires George Soros and Daniel Loeb sold their entire positions in the SPDR Gold Trust exchange-traded fund in the second quarter.

Given so much hatred about gold, should the contrarian investor jump in? No. The odds of runaway inflation is low, equity market returns are likely to be more attractive compared to gold’s in the near term and investors are still in the process of pulling money out of gold funds. There will come a time to challenge the bearish thesis on gold, but investors going long right now could end up being too early.

[stockquote]GOLDBEES[/stockquote]

Source:

Gold bulls lose faith in bullion’s allure
Goldman’s Currie Says Gold Is ‘Slam Dunk’ Sell
Paulson Said to Inform Clients He Won’t Add More to Gold

Gold: The New Normal

Credit Suisse published a report – Gold: The Beginning of the End of an Era – back in February. The basic thesis was that the peak of the fear trade has now passed and that against any sensible benchmark gold still appears significantly overvalued relative to the long run historical experience. Its important to keep the bigger picture in mind before you rush to buy the dips.

Here are some charts from the same report.

Long run gold price, real, 2007 dollars

The real price of gold (2007 dollars) remains at an extreme level

Gold is still near the long run highs in terms of base metals

Is gold really an inflation hedge

Gold is trading 3 standard deviations below the exponential trend


TL;DR: gold is expensive, has broken its uptrend and is a poor inflation hedge (in terms of USD).
[stockquote]GOLDBEES[/stockquote]