Tag: DRREDDY

Analysis: DRREDDY

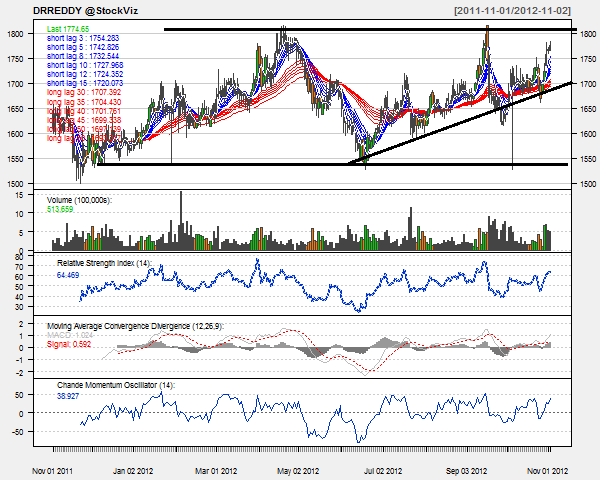
Today’s pick is DRREDDY [stockquote]DRREDDY[/stockquote]. The stock started the year with an up-move to Rs. 1,800 levels. After experiencing resistance at those levels, the stock started its move down. It then saw head-and-shoulders bottom formation during May to July, and since then it has been on an up-trend. It saw the 52 weeks high of Rs. 1,970 in February, but since then was on a down-trend to find support on the trend-line. In the last three months, the stock moved -1% vs. +1 of the Nifty’s.

DRREDDY technical analysis chart

Oscillator RSI and CMO are in no man’s land. The stock is currently trading in the middle of the Bollinger bands. Short-term technical just saw 4X9 and 4X18 bullish SMA cross-over combined with a Dragonfly bullish Doji yesterday.

The MACD line has just penetrated the signal line in a bullish manner. However, the Long-term and short-term GMMA lines are contracting, unable to provide any outlook for the stock.

DRREDDY correlation chart

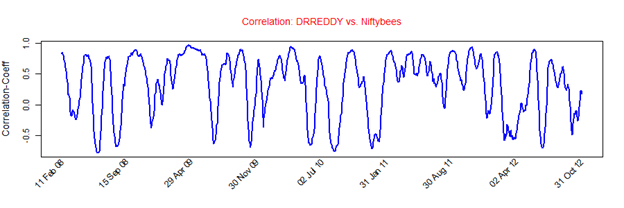
DRREDDY’s average correlation with the Nifty is 0.35 which is positive. The scrip will be replicating movement of Nifty. [stockquote]NIFTYBEES[/stockquote]

DRREDDY volatility chart

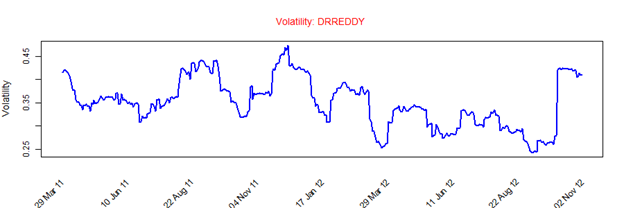
DRREDDY has a historical volatility in the narrow range of 0.25 to 0.45. The scrip’s volatility is currently in the lower end of the range.

Given these technicals, we suggest a short-term BUY. A long-term BUY is also suggested based on the support provided by the trend-line. However, it is advisable to have a relaxed trailing stop-losses level to book profits in case of a trend-reversal.

Analysis: DRREDDY (RDY)

Today’s pick is DRREDDY [stockquote]DRREDDY[/stockquote]. The stock started the year with an uptrend to see the Rs. 1,800 levels. After hovering for a week around the levels it corrected itself to Rs. 1,525 level. Since then the stock has been on an uptrend and it just saw its 52-week’s high of Rs.1,927 during last week. In the last three months, the stock has moved +10% vs. +5% of the Nifty’s.

DRREDDY technical analysis chart

Oscillators RSI and CMO are in the over-bought territory suggesting a short-term correction for stock. The stock just experienced a bullish Dragonfly Doji.

The MACD line is moving towards the signal line, accompanied by the falling histogram levels such movement is suggesting a short-term bearish move for the stock. The long-term and short-term GMMA lines are well dispersed and are suggesting a bullish outlook for the scrip.

DRREDDY correlation chart

DRREDDY’s average correlation with the Nifty is 0.34 is positive. The scrip will be replicating the movement of Nifty. [stockquote]NIFTYBEES[/stockquote]

DRREDDY volatility chart

DRREDDY has a historical volatility in the range of 0.25 to 0.45. The scrip’s volatility currently is in the lower end of the range.

RDY

Analysts are quite positive about the scrip which is a very good sign for the stock. Traders are advised to keep an eye on the forthcoming results as a drift from the analysts expectation can bring about a drastic change for the stock.

Given these technicals, we suggest a short-term Hold. Also looking at the up-trend in place we suggest a long-term Buy for the script. It will be beneficial to have trailing stop-losses in place, in order to book profits if a trend-reversal were to take place.

Enhanced by Zemanta

Analysis: DRREDDY (RDY)

Today’s pick is [stockquote]DRREDDY[/stockquote]. The last year saw the stock trading in a 1500 to 1800 range and the stock is in an up-trend since July lows. In the last three month period, the stock was up 5.5% vs. the Nifty’s 8.3%. The stock is approaching 52-week resistance at 1815 levels, after bouncing off the support at 1500 levels.

image

Oscillators RSI and CMO are at currently at 64 and 39 and are closing in towards the over-bought territory.

MACD line and the signal line are departing from each other on a positive note; the histogram levels are rising as well in-sync with the short-term up-trend.

The GMMA chart shows both long-term and short-term lines fanning out. If this continues, it would be extremely bullish for the stock.

image

DRREDDY’s average correlation of 0.33 with the Nifty is positive. The stock will not replicate the movements of Nifty closely because of the low co-efficient. [stockquote]NIFTYBEES[/stockquote]

image

DRREDDY has a historical volatility in the range of 0.25 to 0.45 which is a very narrow range. The scrip’s volatility is currently in the middle range and hence should not be a concern.

image

Analysts already have high expectations regarding this stock, as is evident from the very high proportion of the buy and outperform calls. A single earnings miss from the firm, or an analyst downgrade might trigger a steep slide in the stock.  Also, insiders have sold about Rs. 3.5 Cr. worth of NCD’s in the last one month period.

Looking at these technicals a short-term hold is suggested. A break-out/continued resistance at the 1800 levels will be essential to direct the stock either to an up-trend/down-trend.

Enhanced by Zemanta