Tag: INFY

UID: Another Scam in the Making

Corruption is something we encounter almost every day. We even abet it on for the sake of convenience. Perhaps corruption has become part of our DNA without our knowing it. Could that be why every private, public or government mass project in India becomes a victim of mismanagement, lag, inaccuracies and corrupt practices? Like the UID project … waiting in queue to join the regular Indian diet of scams.

UID – From whence it comes

UID, Unique Identification or Aadhaar Card as it is more commonly known is vigorously supported by the Congress government. Aadhaar registrations kicked off in September 2010 without “proper debate” in parliament. In fact, the proposed bill was firmly rejected by the parliamentary standing committee on finance chaired by Yashwant Sinha in December 2011. Home minister P. Chidambaram has also expressed his reservations of the project that has no cabinet clearance, making it open to question at any time.

The UID project, guidelines and related technology are coordinated by the Unique Identity Development Authority of India, UI DAI at the center. Implementation at field level is the responsibility of respective state governments. They in turn work with authorized registrars who need UIDs for their own operations. And at the ground there are private or publicly owned agents or NGOs that serve as empanelled enrollment centers. The NPR is an important partner registrar in the enrollment process.

The UID project is headed by Nandan Nilekani, former CEO of Infosys. He was called in for the task by PM, Dr. Manmohan Singh. His team includes enterprisers from private and government circles. Some volunteered for free, some were invited to join. The mammoth project will certainly be a once in a lifetime experience for the UIDAI team but will it have an enduring impact on the lives of the average Indian too?

The UID scheme is expected to cost the country a whopping ₹150,000 crore though some estimate it as higher. At least ₹598 crore rupees have been funneled into services outsourced to partners like MindTree and Accenture among others. While the amount is shocking, what’s worse is the inept execution of the project at ground level.

Misguided, mishandled and misused

Projected as a pro-poor people’s initiative, UID is expected to streamline the delivery of food, water, homes, jobs, security, fuel, and the like to India’s poor as sanctioned under various national schemes. Because analysis tells us that the reason NREGA and other “feed the poor” schemes are falling on their face is because poor people can’t be identified correctly? You’ve got to be kidding. How will fingerprinting and iris scans stop unscrupulous agents from exploiting the poor?

Reports of UID’s shoddy implementation continue to pour in. Almost 30,000 bogus registrations were submitted by an “ex-employee” at a Hyderabad enrollment center. Turns out his credentials were used by other agents across 20 centers. This … when the fingerprint scan of the agent is part of the authentication process. Clearly, the involvement of a technocrat like Nandan Nilekani in the UID project has not prevented technological loopholes from entering the system, allowing miscreants to take advantage.

In other places, free Aadhaar forms are being sold to people standing in queues at MLA’s houses; like black tickets for a show but without the promise of entertainment. Delhi’s MPs and MLAs are blindly handing out necessary documents for UID to woo voters. Diligent people who registered in 2011 are still waiting.

UID – It begs the question WHY?

Inept execution aside, why do we need UID anyway? As an aid for the poor, its usability is suspect. With the way Aadhaar registrations are being manipulated and mishandled, building a clean, accurate and verified UID database of Indian citizens is out of the picture.

From a legal standpoint, the Aadhaar project can be challenged as it hasn’t received parliamentary approval. It allows non-citizens to avail the same benefits as citizens in violation of the Citizenship Act, 1955. And collecting biometric data is an invasion of individuals’ privacy rights in a free country.

Strangely and worryingly, UID is not mandatory. Nilekani says UID is voluntary but service providers might make it mandatory. In the long run I wouldn’t call it compulsory. I’d rather say it will become ubiquitous. This play of words means this: Common people will register on Aadhaar because they naturally want access to subsidies. The uncommon man with plenty to hide can conveniently opt out as he certainly doesn’t need subsidies nor wants his biometrics and private information on record. Bottom line? The UID scheme changes nothing except adding to the taxpayer’s burden.


[stockquote]INFY[/stockquote] [stockquote]MINDTREE[/stockquote]

Analysis: INFY

Today’s pick is INFY [stockquote]INFY[/stockquote]. The stock has been very volatile for most part of the last year. It started the year with a range bound movement between Rs.2,800 and Rs.2,900 and saw a bearish breakdown in April. The stock then fell to Rs. 2,200 levels. After spending 8 months between Rs. 2,200 and Rs. 2,600 the stock broke past the channel in January, to move towards its 52 weeks high of Rs. 3,000 levels. In the last three months, the stock moved +25% vs. a flat Nifty.

INFY Technical Analysis Chart

Oscillator RSI and CMO are currently in no-man’s land. The stock is currently trading in the middle of the Bollinger bands. Short-term technical just saw a 18X9 and 9X4 bearish cross-over.

The MACD line has bearishly penetrated the signal line, and the histogram levels are dropping to confirm the bearish move. However, the Long-term GMMA lines have been expanding as opposed to the contracting short-term lines. This is adding to the in-decisiveness about the direction of stock move.

INFY Correlation chart

INFY’s average correlation with the Nifty is 0.50, which is positive. The scrip will be replicating movement of Nifty. [stockquote]NIFTYBEES[/stockquote]

INFY Volatility chart

INFY has a historical volatility in the narrow range of 0.2 to 0.7. The scrip’s volatility is currently in the lower end of the range.

INFY Analysts Coverage

Analysts have a bullish outlook for the stock, the next set of earnings might make a difference in the stocks outlook.

Given the technicals, we suggest a short-term Hold. A long-term hold is also suggested if the stock holds above Rs. 2,600. Also, it is advisable to have a relaxed trailing stop-losses level to book profits in case of a sudden trend-reversal.

Analysis: INFY

Today’s pick is INFY [stockquote]INFY[/stockquote]. The stock was moving in a range till March since starting of the year. It then fell sharply to Rs. 2,400 levels in April after moving in range till July the stock again fell to Rs. 2,200 levels. Since then the stock has been on an uptrend. In the last three months, the stock has moved +16% vs. +5% of the Nifty’s.

INFY technical analysis chart

Oscillator RSI is hovering in the over-bought territory whereas CMO is in no man’s land. The stock is trading in the middle of Bollinger band not suggesting any directional move. However, short-term technical just saw 9×4 bearish cross-over.

The MACD line has just penetrated the signal line in a bearish manner. However, both long-term and short-term GMMA lines are very distant from each other, giving out an extremely bullish sign for the scrip.

INFY correlation chart

INFY’s average correlation with the Nifty is 0.51 which is positive. The scrip will be replicating movement of Nifty. [stockquote]NIFTYBEES[/stockquote]

INFY volatility chart

INFY has a historical volatility in the range of 0.2 to 0.7. The scrip’s volatility is currently in the higher end of the range.

INFY Analyst coverage

Majority of analysts are suggesting a hold for this stock given the current condition of the IT industry.

Given these technicals, we suggest a short-term sell. For the long-term, we suggest a buy given the well spread out GMMA lines. However, we recommend that investors tread with caution given that the spread in the GMMA lines has occurred due to the +20% spike seen at the most recent earnings announcement. Also, for risk management we suggest having trailing stop-losses in case trend-reversal were to take place.

Analysis: INFY

Today’s pick is [stockquote]INFY[/stockquote]. The stock has been in a down-trend since highs of Feb. However, since late August, the stock has seen a pennant formation. In the last three month period, the stock was up 2% Vs. 4% as that of Nifty’s return.

We had issued a short-term buy last month that didn’t quite pan out as we expected – the stock is basically flat since then, stuck in a narrow range.

stock

Oscillators RSI and CMO are at currently at 50 and -3 are in no men’s land.

MACD line and the signal line are moving very close to each other and are not suggesting any trend.

The GMMA long-term as well as short-term lines are running very close to each other and are not able to suggest any direction.

cor

INFY’s average correlation of 0.52 with the Nifty is positive and strong. The stock will replicate the movements of Nifty because of the co-efficient. [stockquote]NIFTYBEES[/stockquote]

vol

INFY has a historical volatility in the range of 0.2 to 0.7. The scrip’s volatility is currently towards the lower side of the range.

analyst


Analysts have quite a high expectation regarding the stock. A drift in the earnings compared to the analysts expectation might pull the stock down. The stock saw stock selling by an insider worth Rs. 1 Cr. a couple of weeks ago.

Looking at these technicals we suggest that investors keep off this scrip for the short-term. A break-out of the pennant in either direction will trigger a longer-term call.

Enhanced by Zemanta

Analysis: INFY

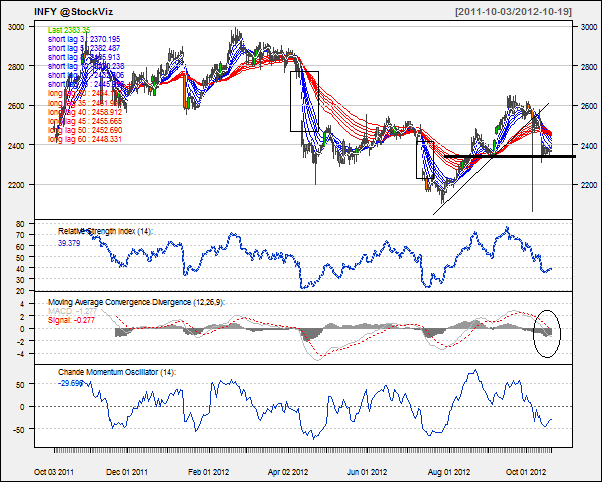
Today’s pick is [stockquote]INFY[/stockquote]. Even though the stock has experienced a high of 3000 and a low of 2150 during the last 12 months, it is still trading at roughly the same price as it was a year ago.

The stock has seen two drastic gap downs over the last 7 months. The up-trend since mid-July saw a tip-off near 2600 levels which might act as a near-term resistance level.

Looking at the chart for the last 2 months, a head and shoulder top might seem to be in formation if the current up-trend stalls and take a turn around 2450 levels on higher volumes.

image

Oscillators RSI and CMO are at currently at 39 and -30. At this level of RSI, the stock has still got around 15 points to reach oversold levels. The CMO will also take time to reach the oversold side. These technicals are not giving out any signal currently.

MACD line and signal line are closing in towards each other and histogram levels are dropping off as well. The behavior of histogram (a decreasing slope) can act as an early signal of the imminent short-term up-trend.

The GMMA chart for the long term signal is suggesting a change in direction (uptrend since July) for the scrip. The short term lines are moving up again suggesting an up-trend after the last fall. A penetration of the short term lines with good volumes can bring about the up-trend for the stock.

image

Infosys’s average correlation of 0.53 with the Niftybees is positive but not very strong. At this level the movements of the stock will not be of the same magnitude as Niftybees. [stockquote]NIFTYBEES[/stockquote]

image

Infosys has a historical volatility in the range of 0.2 to 0.6. The current volatility is is a result of the EMKAY trades and it should not be a cause of concern.

Looking at these technicals, it appears that the stock is presently nearing oversold territory. A short term buy would be a good idea but for the long term you might want to wait and watch until those long term lines of GMMA dis-entangle themselves to take a stand.

Enhanced by Zemanta