Lagged correlations
Excess winter snow-fall in the Himalayas lead to floods in Bangladesh during spring. If we know that that there was excess snow-fall in the Himalayas this season, we can be better prepared to handle the floods four-months from now. This is the idea behind studying lagged correlations.
If we took a pair of sector indices and lagged their returns, can we find an index that “leads” an other and profit from it?
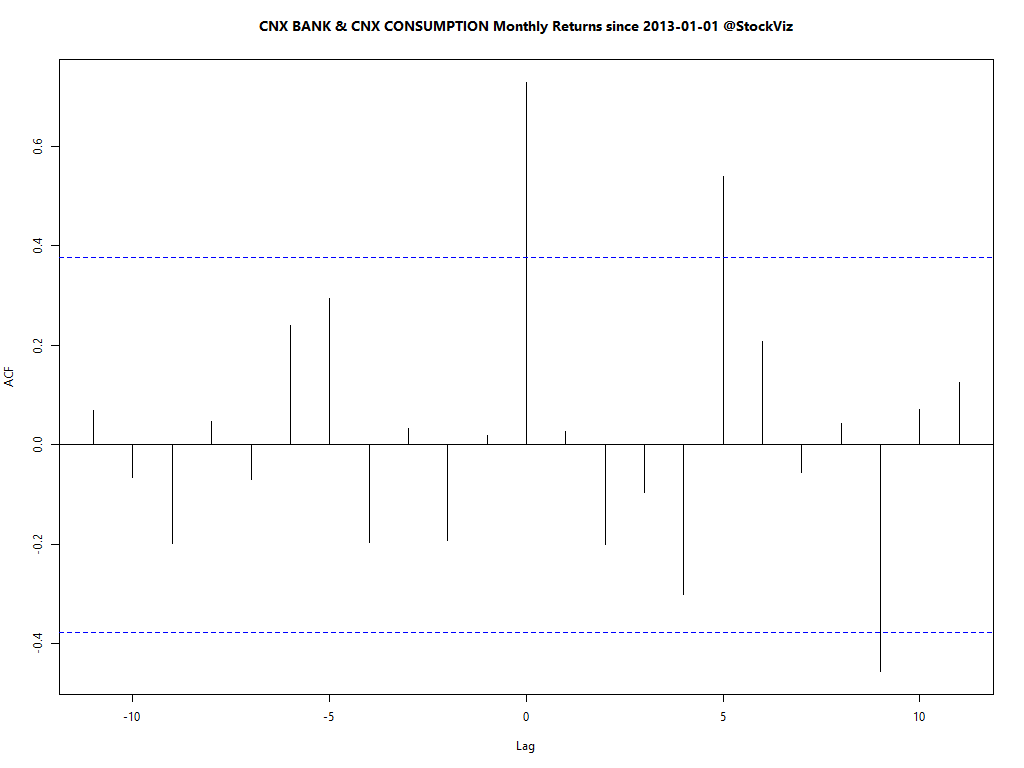
The chart above is called the cross-correlation plot. It shows that there are two lags, 5 and 9, where CNX BANK lags CONSUMPTION. A scatter plot shows how monthly-returns are correlated to each other across different lags and confirms the relationship:

Finding
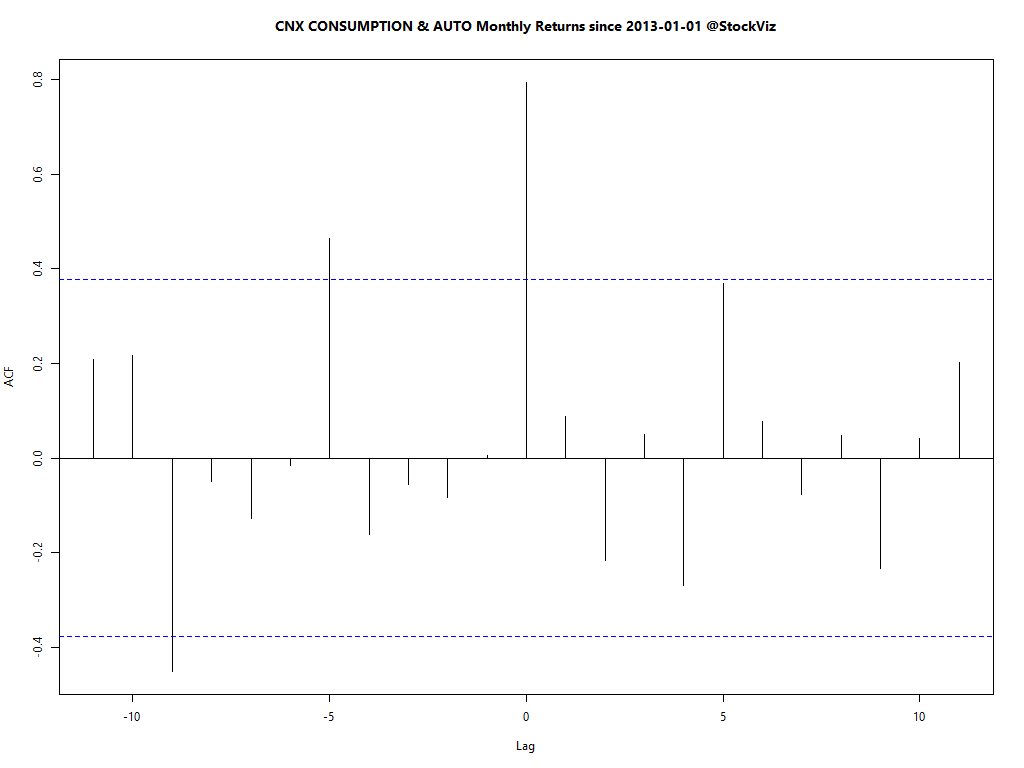
We found a number of index pairs that lead/follow one another. In addition to the CNX BANK and CNX CONSUMPTION indices above, CNX INFRA and CNX CONSUMPTION, CNX IT and CNX FINANCE, CNX CONSUMPTION and AUTO display this dynamic.


Data mining warning
We cannot draw any conclusion from this “finding.” We mined 20 indices over 5 years to dig these nuggets out. The result is spurious. From a statistical point of view, there is no index that consistently leads or lags another.
Related: Should you care about monthly returns of the Nifty?
Comments are closed, but trackbacks and pingbacks are open.